
 | ||
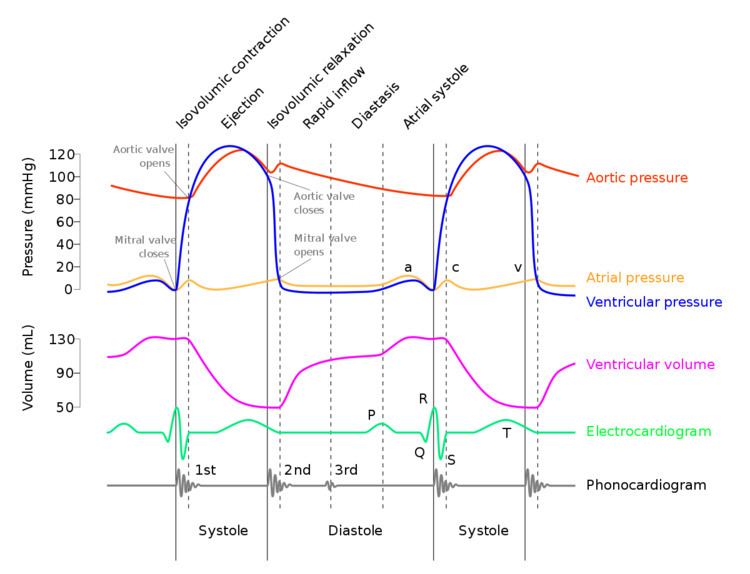
A Wiggers diagram is a standard diagram used in cardiac physiology named after Dr. Carl J. Wiggers.
The X axis is used to plot time, while the Y axis contains all of the following on a single grid:
By illustrating the coordinated variation of these values, it becomes easier to illustrate the relationship between these values in the cardiac cycle.
Events
Note that during isovolumetric/isovolumic contraction and relaxation, all the heart valves are closed. At no time are all the heart valves open.
References
Wiggers diagram Wikipedia(Text) CC BY-SA