
 | ||
Elections for the United States House of Representatives were held on November 7, 2006, with all of the 435 seats in the House up for election. This article discusses predictions for outcome of House races as a whole. Individual races that were notable are discussed in detail (a paragraph or so, each) at United States House elections, 2006; that article also has information on the results of the election.
Contents
- Summary of analyses
- Tradesports
- Iowa Electronic Markets
- Details of non partisan election analyses
- Cook Political Report
- CQPoliticscom
- Larry Sabatos Crystal Ball
- Electoral votecom
- Pollstercom
- Majority Watch
- Rothenberg Political Report
- politicalforecastingcom
- unfutz Ed Fitzgeralds survey of polls
- Polling map November 6 2006
- References
The predictions below were those made just before the election was held.
Summary of analyses
Below is a table summarizing various non-partisan election analyses. Although the nomenclature varies slightly, the categories can be understood as follows:
"Safe" — the race was not expected to become competitive.
"Favored" — the race was not competitive, but might become competitive if new political factors intervened.
"Leans" — the race was competitive, but one candidate had a clear advantage.
"Tossup" — neither candidate had a clear advantage.
Tradesports
Tradesports offers a contract on the Republicans retaining control of the House. On Tuesday, November 7 at 09:31 PM GMT it was indicating a probability of 16.1% that the Republicans will retain the House.[1]
Iowa Electronic Markets
Iowa Electronic Markets offers four contracts covering all possible outcomes of the House and Senate elections.
As of 9:15 PM GMT, Tuesday, November 7, 2006, the two contracts predicting Republican control of the House were trading at $0.140-0.219 and $0.002-$0.010 respectively. Adding these values resulted in a probability of between 14.2% and 22.9% of Republicans retaining control of the House.[2]
Details of non-partisan election analyses
Because of the large number of individual races covered by nationwide political services, these analyses often were a week or two behind the results obtained by local polling organization, but are still very useful.
Cook Political Report
The Cook Political Report, an independent, non-partisan election analysis newsletter, listed 89 seats - 68 held by Republicans and 21 by Democrats - as being potentially in play.
As of November 6, 2006:
CQPolitics.com
CQPolitics.com, an independent, non-partisan election analysis newsletter, at the end of November 6, 2006, made the following analysis:
Larry Sabato's Crystal Ball
In early August, Sabato predicted a pro-Democratic shift of 12-15 seats in the House. In mid-October, he revised his estimate, predicting a net gain for the Democrats of 18-22 seats. On October 26, he revised his estimate to 21-26, November 2, he upped his estimate to 24-30, and on the day before the election, he raised it to 25-33 with the following breakdown:
Electoral-vote.com
Electoral-vote.com is a site run by Andrew Tanenbaum, a professor of computer science at Vrije Universiteit. While it mostly covered Senate races in 2006, it also made algorithmic predictions for the House-based entirely on independent polling data. (Where no independent polls exist, the 2004 election results were used).
As of November 2, Electoral-vote.com was predicting 38 Democratic pickups and no Republican pickups.
His calculations predict the House to comprise: 240 Democrats, 193 Republicans, 1 Ties. The Democratic pickups are: AZ-05 AZ-08 CA-11 CO-04 CO-07 CT-02 CT-04 CT-05 FL-13 FL-16 FL-22 IA-01 IL-06 IL-10 IN-02 IN-08 IN-09 KY-03 KY-04 NC-08 NC-11 NH-02 NM-01 NY-19 NY-20 NY-24 NY-25 NY-29 OH-01 OH-02 OH-15 OH-18 PA-06 PA-07 PA-08 PA-10 TX-22 WI-08
Pollster.com
"Mystery Pollster" Mark Blumenthal and University of Wisconsin–Madison Professor Charles Franklin aggregated polling data for more than 60 competitive house races and offered objective analysis on the methodology and the reliability of the numbers. On October 1, 2006, it began to post the most recent polls for these 60+ districts as soon as they were released to the public.
Majority Watch
Majority Watch is a non-partisan poll from RT Strategies and Constituent Dynamics. Their polling is done by automated telephone surveys of likely voters.
Rothenberg Political Report
The Rothenberg Political Report is a non-partisan analysis of American politics and elections. Stuart Rothenberg is a regular columnist in Roll Call. On Nov 6 he predicted a Democratic gain of 30-36 seats, with the following breakdown:[3]
politicalforecasting.com
At politicalforecasting.com [4], predictions for the 2006 House of Representatives elections were categorized by method (e.g., statistical models, prediction markets) and averaged within and across methods to arrive at the Pollyseat, the number of seats the Republicans are expected to lose on November 7. As of October 30, the Pollyseat value stood at 21. In other words, the Republicans were expected to lose control of the House of Representatives.
unfutz: Ed Fitzgerald's survey of polls
Ed Fitzgerald, at his blog, unfutz, compiled a summary of several dozen forecasters, with statistics and charts.
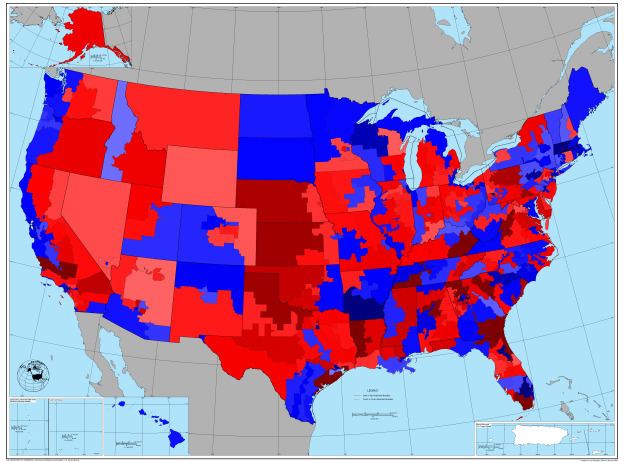
Polling map - November 6, 2006
The map below shows the latest polling information as of November 6, 2006, for House races. No party polls included. Darker colors indicate stronger support. Where no polls were available, last year's election results were used. If two polls tied for most recent, the longer poll was used.