
2 May 1985 (England & Wales)
15 May 1985 (Northern Ireland) 1986 → 32% 39% 10,191 8,746 | 11 February 1975 2 October 1983 39% 26% Start date 1985 | |
 | ||
2 October 1983 7 July 1976 (Steel)
21 June 1983 (Owen) | ||
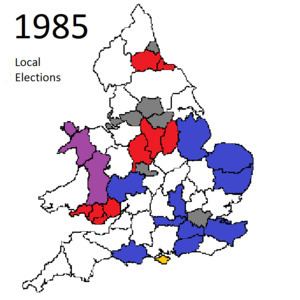
Local elections were held in the United Kingdom in 1985. The projected share of the vote was Labour 39%, Conservative 32%, Liberal-SDP Alliance 26%. Labour had the largest share of the vote in local council elections for the first time since 1981.
Both Conservatives and Labour lost some seats to the Liberal-SDP Alliance, who were rebuilding under the leadership of David Owen and enjoying strong showings (including a brief lead) in the opinion polls.
The overall results were as follows;
Conservative losses: 202
Number of Conservative councillors: 10,191
Labour losses: 124
Number of Labour councillors: 8,746
Liberal-SDP Alliance gains: 302
Number of Liberal-SDP Alliance councillors: 2,633
Non-metropolitan county councils
‡ New electoral division boundaries
References
United Kingdom local elections, 1985 Wikipedia(Text) CC BY-SA