
 | ||
A Temporal Raster Plot is a graphic representation of occurrences in a certain temporal relation. Temporal Raster Plots are also sometimes referred to as carpet plots.
Each occurrence is registered in a Cartesian coordinate system, in which both axes show time, have different time resolutions: one axis shows slices of data, the other some sensible interval. A common example would be that one axis shows hours in a day, the other days in a year.
In a 2D plot, the value to be plotted is coded with an intensity or a color. In the 3D variant of the plot, it is often coded as a height. When visualized, particularly the color-coded variant of the plot may easily show a carpet-like pattern.
Temporal Raster Plots make it easy to show time-based relations within a large sets of time-interval data and often make it easy to recognize local maxima and minima. Assuming the chosen time division is related to the events, it is also easy to recognize global and local patterns, such as recurrent events.
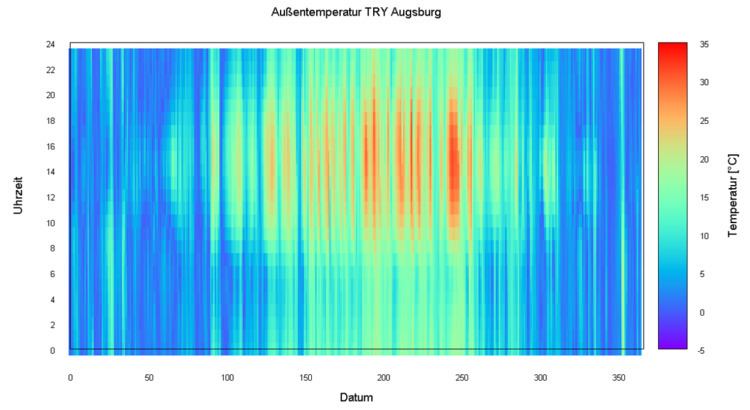
In the following example, the data is one year's worth of measurements of the outdoor temperatures in Augsburg, with four samples taken per hour. In the according carpet diagram, each column represents a day in the year and contains the values for that day (from 0:00 until 23:45). Despite the high number of measure points (about 35000) it is easy to distinguish local and global patterns.
Note the similarity to beat graphs as described by Werner Van Belle.