
 | ||
In oceanography, Temperature-salinity diagrams, sometimes called T-S diagrams, are used to identify water masses. Their principle value comes from being conservative properties, which means they are not influenced by biological activity. Both temperature and salinity only change by either interaction with the atmosphere or by mixing with other water masses. Because deep water does not interact with the atmosphere between its formation and resurfacing at the end of its circulation path, deep water masses retain their temperature and salinity properties for extended periods of time. Water mixes more readily with water that is the same density, so the mixing rate of the water masses is fairly slow. The relative constancy of the temperature and salinity allows scientists to determine where the water mass has formed and with what it has mixed.
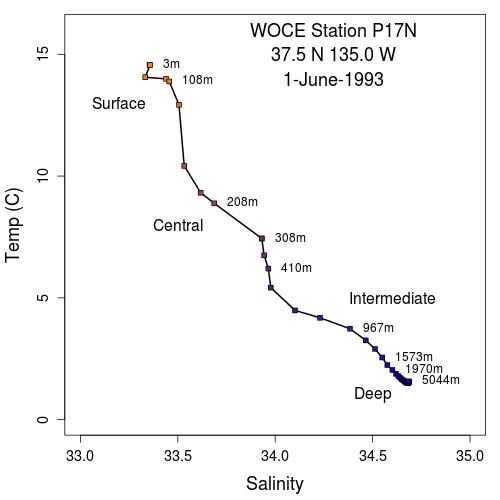
By convention, salinity is plotted on the x-axis and temperature on the y-axis. Temperature and salinity combine to form the water's density, which is represented in the diagram by lines of equal density. The isopycnals, as lines of equal density are called, are determined by the interaction of temperature and salinity. Water masses can be distinguished by their characteristic temperature-salinity profiles, which are determined by their formation conditions at the surface.