
November 8, 2016 (2016-11-08) 2020 → | No data 4 | |
 | ||
This article is a collection of statewide polls for the United States presidential election, 2016. The polls listed here provide early data on opinion polling between the Democratic candidate, the Republican candidate, the Libertarian candidate, and the Green candidate. Prior to the parties' conventions, presumptive candidates were included in the polls. Not all states will conduct polling for the election due to various factors. States that are considered swing states usually put out more polls as more attention is given to the results. For determining a statistical tie, the margin of error provided by the polling source is applied to the result for each candidate. This article displays each candidate's potential electoral vote total and is not a prediction of the current state of the election.
Contents
- Most recent polling
- Alabama
- Alaska
- Arizona
- Arkansas
- California
- Colorado
- Connecticut
- Delaware
- District of Columbia
- Florida
- Georgia
- Hawaii
- Idaho
- Illinois
- Indiana
- Iowa
- Kansas
- Kentucky
- Louisiana
- Maine
- Maryland
- Massachusetts
- Michigan
- Minnesota
- Mississippi
- Missouri
- Montana
- Nebraska
- Nevada
- New Hampshire
- New Jersey
- New Mexico
- New York
- North Carolina
- North Dakota
- Ohio
- Oklahoma
- Oregon
- Pennsylvania
- Rhode Island
- South Carolina
- South Dakota
- Tennessee
- Texas
- Utah
- Vermont
- Virginia
- Washington
- West Virginia
- Wisconsin
- Wyoming
- References
Most recent polling
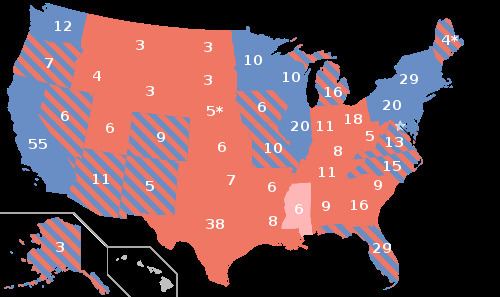
Hillary Clinton has a vote lead among states recently polled. State polls with results outside the margin of error presently show 213 potential electoral votes for Clinton and 162 potential electoral votes for Donald Trump. In 14 states and two congressional districts (150 electoral votes), results for Clinton and Trump are within the margin of error. For the two states and one district without recent polling, one state (6 electoral votes) voted for Mitt Romney in the 2012 election, while one state and district (7 electoral votes) voted for Barack Obama. Third party candidates, such as Jill Stein and Gary Johnson, are also included in many statewide polls. They have not received support in statewide polling that surpasses the two main party nominees. Independent candidate Evan McMullin is presently tied with Donald Trump in the state of Utah, but has only been included on a very limited number of statewide polls.
Alabama
9 electoral votes
(Republican in 2008) 60%–39%
(Republican in 2012) 61%–38%
Winner
(Republican in 2016) 62%-34%
Poll numbers verified as of October 24, 2016.
Alaska
3 electoral votes
(Republican in 2008) 59%–38%
(Republican in 2012) 55%–41%
Winner
(Republican in 2016) 51%-37%
Poll numbers verified as of October 24, 2016.
Two-way race
Four-way race
Arizona
11 electoral votes
(Republican in 2008) 53%–45%
(Republican in 2012) 53%–44%
Winner
(Republican in 2016) 49%-45%
Poll numbers verified as of October 20, 2016.
Arkansas
6 electoral votes
(Republican in 2008) 59%–39%
(Republican in 2012) 61%–37%
Winner
(Republican in 2016) 61%-34%
Poll numbers verified as of October 24, 2016.
California
55 electoral votes
(Democratic in 2008) 61%–37%
(Democratic in 2012) 60%–37%
Winner
(Democratic in 2016) 62%-32%
Poll numbers verified as of October 24, 2016.
Colorado
9 electoral votes
(Democratic in 2008) 54%–45%
(Democratic in 2012) 51%–46%
Winner
(Democratic in 2016) 48%-43%
Poll numbers verified as of October 24, 2016.
Connecticut
7 electoral votes
(Democratic in 2008) 61%–38%
(Democratic in 2012) 58%–41%
Winner
(Democratic in 2016) 55%-41%
Poll numbers verified as of October 24, 2016.
Delaware
3 electoral votes
(Democratic in 2008) 62%–37%
(Democratic in 2012) 59%–40%
Winner
(Democratic in 2016) 53%-42%
Poll numbers verified as of October 26, 2016.
District of Columbia
3 electoral votes
(Democratic in 2008) 92%–7%
(Democratic in 2012) 91%–7%
Winner
(Democratic in 2016) 91%-4%
Poll numbers verified as of October 26, 2016.
No polling was conducted post August 1, 2016
Florida
29 electoral votes
(Democratic in 2008) 51%–48%
(Democratic in 2012) 50%–49%
Winner
(Republican in 2016) 49%-48%
Poll numbers verified as of October 26, 2016.
Georgia
16 electoral votes
(Republican in 2008) 52%–47%
(Republican in 2012) 53%–45%
Winner
(Republican in 2016) 51%-46%
Poll numbers verified as of October 24, 2016.
Hawaii
4 electoral votes
(Democratic in 2008) 72%–27%
(Democratic in 2012) 71%–28%
Winner
(Democratic in 2016) 62%-30%
Poll numbers verified as of October 26, 2016.
No polls conducted yet
Idaho
4 electoral votes
(Republican in 2008) 61%–36%
(Republican in 2012) 64%–32%
Winner
(Republican in 2016) 59%-27%
Poll numbers verified as of October 26, 2016.
Illinois
20 electoral votes
(Democratic in 2008) 62%–37%
(Democratic in 2012) 58%–41%
Winner
(Democratic in 2016) 56%-39%
Poll numbers verified as of October 26, 2016.
Indiana
11 electoral votes
(Democratic in 2008) 50%–49%
(Republican in 2012) 54%–44%
Winner
(Republican in 2016) 57%-38%
Poll numbers verified as of October 27, 2016.
Iowa
6 electoral votes
(Democratic in 2008) 54%–44%
(Democratic in 2012) 52%–46%
Winner
(Republican in 2016) 51%-42%
Poll numbers verified as of October 27, 2016.
Kansas
6 electoral votes
(Republican in 2008) 56%–42%
(Republican in 2012) 60%–38%
Winner
(Republican in 2016) 57%-36%
Poll numbers verified as of October 27, 2016.
Kentucky
8 electoral votes
(Republican in 2008) 57%–41%
(Republican in 2012) 60%–38%
Poll numbers verified as of October 27, 2016.
Louisiana
8 electoral votes
(Republican in 2008) 59%–40%
(Republican in 2012) 58%–41%
Poll numbers verified as of October 27, 2016.
Three-way race
Maine
4 electoral votes (Statewide vote worth 2 EVs; 1st and 2nd congressional districts worth 1 EV each)
(Democratic in 2008) 58%–40%
(Democratic in 2012) 56%–41%
Poll numbers verified as of October 27, 2016.
Four-way race
Maryland
10 electoral votes
(Democratic in 2008) 62%–36%
(Democratic in 2012) 62%–36%
Poll numbers verified as of October 27, 2016.
Massachusetts
11 electoral votes
(Democratic in 2008) 62%–36%
(Democratic in 2012) 61%–38%
Poll numbers verified as of October 14, 2016.
Four-way race
Michigan
16 electoral votes
(Democratic in 2008) 57%–41%
(Democratic in 2012) 54%–45%
Poll numbers verified as of October 27, 2016.
Four-way race
Minnesota
10 electoral votes
(Democratic in 2008) 54%–44%
(Democratic in 2012) 53%–45%
Poll numbers verified as of October 27, 2016.
Four-way race
Mississippi
6 electoral votes
(Republican in 2008) 56%–43%
(Republican in 2012) 55%–44%
Poll numbers verified as of October 27, 2016.
No polling conducted post September 1, 2016
Missouri
10 electoral votes
(Republican in 2008) 49.4%–49.2%
(Republican in 2012) 53%–44%
Poll numbers verified as of October 27, 2016.
Three-way race
Four-way race
Montana
3 electoral votes
(Republican in 2008) 49%–47%
(Republican in 2012) 55%–42%
Poll numbers verified as of October 27, 2016.
Three-way race
Nebraska
5 electoral votes (Statewide vote worth 2 EVs; 1st, 2nd, and 3rd congressional districts worth 1 EV each)
(Republican in 2008) 57%–42%
(Republican in 2012) 60%–38%
Poll numbers verified as of October 27, 2016.
Nevada
6 electoral votes
(Democratic in 2008) 55%–43%
(Democratic in 2012) 52%–46%
Aggregate polls Poll numbers verified as of October 27, 2016.
Two-way race
Three-way
Four-way race
Five-way race
New Hampshire
4 electoral votes
(Democratic in 2008) 54%–45%
(Democratic in 2012) 52%–46%
Poll numbers verified as of October 28, 2016.
Four-way race
New Jersey
14 electoral votes
(Democratic in 2008) 57%–42%
(Democratic in 2012) 58%–41%
Poll numbers verified as of October 24, 2016.
Four-way race
New Mexico
5 electoral votes
(Democratic in 2008) 57%–42%
(Democratic in 2012) 53%–43%
Poll numbers verified as of October 24, 2016.
New York
29 electoral votes
(Democratic in 2008) 63%–36%
(Democratic in 2012) 63%–35%
Poll numbers verified as of October 24, 2016.
Four-way race
North Carolina
15 electoral votes
(Democratic in 2008) 50%–49%
(Republican in 2012) 50%–48%
Poll numbers verified as of October 24, 2016.
Three-way race
Four-way race
North Dakota
3 electoral votes
(Republican in 2008) 53%–45%
(Republican in 2012) 58%–39%
Poll numbers verified as of October 20, 2016.
Four-way race
Ohio
18 electoral votes
(Democratic in 2008) 51%–47%
(Democratic in 2012) 51%–48%
Poll numbers verified as of October 20, 2016.
Three-way race
Four-way race
Five-way race
Oklahoma
7 electoral votes
(Republican in 2008) 66%–34%
(Republican in 2012) 67%–33%
Poll numbers verified as of October 20, 2016.
Three-way race
Oregon
7 electoral votes
(Democratic in 2008) 57%–40%
(Democratic in 2012) 54%–42%
Poll numbers verified as of October 20, 2016.
Four-way race
Pennsylvania
20 electoral votes
(Democratic in 2008) 54%–44%
(Democratic in 2012) 52%–47%
Poll numbers verified as of October 28, 2016.
Three-way race
Four-way race
Rhode Island
4 electoral votes
(Democratic in 2008) 63%–35%
(Democratic in 2012) 63%–35%
Poll numbers verified as of October 28, 2016.
Four-way race
South Carolina
9 electoral votes
(Republican in 2008) 54%–45%
(Republican in 2012) 55%–44%
Poll numbers verified as of October 28, 2016.
Four-way race
South Dakota
3 electoral votes
(Republican in 2008) 53%–45%
(Republican in 2012) 58%–40%
Poll numbers verified as of October 28, 2016.
Three-way race
Four-way race
Tennessee
11 electoral votes
(Republican in 2008) 57%–42%
(Republican in 2012) 59%–39%
Poll numbers verified as of October 28, 2016.
Four-way race
Texas
38 electoral votes
(Republican in 2008) 55%–44%
(Republican in 2012) 57%–41%
Poll numbers verified as of October 28, 2016.
Two-way race
Three-way race
Four-way race
Utah
6 electoral votes
(Republican in 2008) 62%–34%
(Republican in 2012) 73%–25%
Poll numbers verified as of October 28, 2016.
Vermont
3 electoral votes
(Democratic in 2008) 67%–30%
(Democratic in 2012) 67%–31%
Poll numbers verified as of October 28, 2016.
Four-way race
Virginia
13 electoral votes
(Democratic in 2008) 53%–46%
(Democratic in 2012) 51%–47%
Poll numbers verified as of October 28, 2016.
Three-way race
Four-way race
Five-way race
Washington
12 electoral votes
(Democratic in 2008) 57%–40%
(Democratic in 2012) 56%–41%
Poll numbers verified as of October 28, 2016.
Two-way race
Four-way race
West Virginia
5 electoral votes
(Republican in 2008) 56%–43%
(Republican in 2012) 62%–36%
Poll numbers verified as of October 28, 2016.
Wisconsin
10 electoral votes
(Democratic in 2008) 56%–42%
(Democratic in 2012) 53%–46%
Poll numbers verified as of October 28, 2016.
Three-way race
Four-way race
Wyoming
3 electoral votes
(Republican in 2008) 65%–33%
(Republican in 2012) 69%–28%
Poll numbers verified as of October 28, 2016.
Four-way race