Spartan is a molecular modelling and computational chemistry application from Wavefunction. It contains code for molecular mechanics, semi-empirical methods, ab initio models, density functional models, post-Hartree–Fock models, and thermochemical recipes including G3(MP2) and T1.
Primary functions are to supply information about structures, relative stabilities and other properties of isolated molecules. Molecular mechanics calculations on complex molecules are common in the chemical community. Quantum chemical calculations, including Hartree–Fock method molecular orbital calculations, but especially calculations that include electronic correlation, are more time consuming in comparison.
Quantum chemical calculations are also called upon to furnish information about mechanisms and product distributions of chemical reactions, either directly by calculations on transition states, or based on Hammond's postulate, by modeling the steric and electronic demands of the reactants. Quantitative calculations, leading directly to information about the geometries of transition states, and about reaction mechanisms in general, are increasingly common, while qualitative models are still needed for systems that are too large to be subjected to more rigorous treatments. Quantum chemical calculations can supply information to complement existing experimental data or replace it altogether, for example, atomic charges for quantitative structure-activity relationship (QSAR) analyses, and intermolecular potentials for molecular mechanics and molecular dynamics calculations.
Spartan applies computational chemistry methods (theoretical models) to many standard tasks that provide calculated data applicable to the determination of molecular shape conformation, structure (equilibrium and transition state geometry), NMR, IR, Raman, and UV-visible spectra, molecular (and atomic) properties, reactivity, and selectivity.
This software provides the molecular mechanics, Merck Molecular Force Field (MMFF), (for validation test suite), MMFF with extensions, and SYBYL, force fields calculation, Semi-empirical calculations, MNDO/MNDO(D), Austin Model 1 (AM1), PM3, Recife Model 1 (RM1) PM6.
Hartree–Fock, self-consistent field (SCF) methods, available with implicit solvent (SM8).Restricted, unrestricted, and restricted open-shell Hartree–Fock
Density functional theory (DFT) methods, available with implicit solvent (SM8).Standard functionals: BP, BLYP, B3LYP, EDF1, EDF2, M06, ωB97X-D
Exchange functionals: HF, Slater-Dirac, Becke88, Gill96, GG99, B(EDF1), PW91
Correlation functionals: VWN, LYP, PW91, P86, PZ81, PBE.
Combination or hybrid functionals: B3PW91, B3LYP, B3LYP5, EDF1, EDF2, BMKTruhlar group functionals: M05, M05-2X, M06, M06-L M06-2X, M06-HF
Head-Gordon group functionals: ωB97, ωB97X, ωB97X-D
Coupled cluster methods.
CCSD, CCSD(T), CCSD(2), OD, OD(T), OD(2), QCCD, VOD, VOD(2), VQCCD
Møller–Plesset methods.
MP2, MP3, MP4, RI-MP2
Excited state methods.
Time-dependent density functional theory (TDDFT)
Configuration interaction: CIS, CIS(D), QCIS(D), quadratic configuration interaction (QCISD(T)), RI-CIS(D)
Quantum chemistry composite methods, thermochemical recipes.
T1, G2, G3, G3(MP2)
Available computational models provide molecular, thermodynamic, QSAR, atomic, graphical, and spectral properties. A calculation dialogue provides access to the following computational tasks:
Energy - For a given geometry, provides energy and associated properties of a molecule or system. If quantum chemical models are employed, the wave function is calculated.
Equilibrium molecular geometry - Locates the nearest local minimum and provides energy and associated properties.
Transition state geometry - Locates the nearest first-order saddle point (a maximum in a single dimension and minima in all others) and provides energy and associated properties.
Equilibrium conformer - Locates lowest-energy conformation. Often performed before calculating structure using a quantum chemical model.
Conformer distribution - Obtains a selection of low-energy conformers. Commonly used to identify the shapes a specific molecule is likely to adopt and to determine a Boltzmann distribution for calculating average molecular properties.
Conformer library - Locates lowest-energy conformer and associates this with a set of conformers spanning all shapes accessible to the molecule without regard to energy. Used to build libraries for similarity analysis.
Energy profile - Steps a molecule or system through a user defined coordinate set, providing equilibrium geometries for each step (subject to user-specified constraints).
Similarity analysis - quantifies the likeness of molecules (and optionally their conformers) based on either structure or chemical function (Hydrogen bond acceptors–donors, positive–negative ionizables, hydrophobes, aromatics). Quantifies likeness of a molecule (and optionally its conformers) to a pharmacophore.
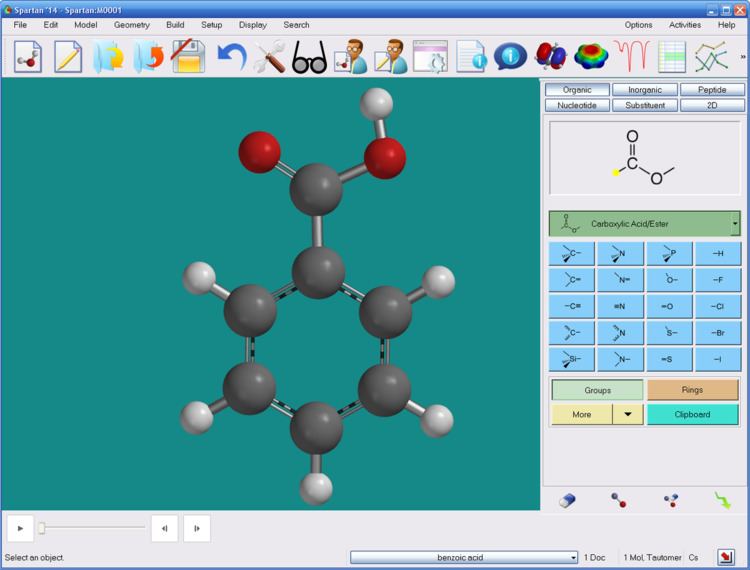
The software contains an integrated graphical user interface. Touch screen operations are supported for Windows 7 and 8 devices. Construction of molecules in 3D is facilitated with molecule builders (included are organic, inorganic, peptide, nucleotide, and substituent builders). 2D construction is supported for organic molecules with a 2D sketch palette. The Windows version interface can access ChemDraw; which versions 9.0 or later may also be used for molecule building in 2D. A calculations dialogue is used for specification of task and computational method. Data from calculations are displayed in dialogues, or as text output. Additional data analysis, including linear regression, is possible from an internal spreadsheet.
Graphical models, especially molecular orbitals, electron density, and electrostatic potential maps, are a routine means of molecular visualization in chemistry education.
Surfaces:
Molecular orbitals (highest occupied, lowest unoccupied, and others)
Electron density - The density, ρ(r), is a function of the coordinates r, defined such that ρ(r)dr is the number of electrons inside a small volume dr. This is what is measured in an X-ray diffraction experiment. The density may be portrayed in terms of an isosurface (isodensity surface) with the size and shape of the surface being given by the value (or percentage of enclosure) of the electron density.
Spin density - The density, ρspin(r), is defined as the difference in electron density formed by electrons of α spin, ρα(r), and the electron density formed by electrons of β spin, ρβ(r). For closed-shell molecules (in which all electrons are paired), the spin density is zero everywhere. For open-shell molecules (in which one or more electrons are unpaired), the spin density indicates the distribution of unpaired electrons. Spin density is an indicator of reactivity of radicals.
Van der Waals radius (surface)
Solvent accessible surface area
Electrostatic potential - The potential, εp, is defined as the energy of interaction of a positive point charge located at p with the nuclei and electrons of a molecule. A surface for which the electrostatic potential is negative (a negative potential surface) delineates regions in a molecule which are subject to electrophilic attack.
Composite surfaces (maps):
Electrostatic potential map (electrophilic indicator) - The most commonly employed property map is the electrostatic potential map. This gives the potential at locations on a particular surface, most commonly a surface of electron density corresponding to overall molecular size.
Local ionization potential map - Is defined as the sum over orbital electron densities, ρi(r) times absolute orbital energies, ∈i, and divided by the total electron density, ρ(r). The local ionization potential reflects the relative ease of electron removal ("ionization") at any location around a molecule. For example, a surface of "low" local ionization potential for sulfur tetrafluoride demarks the areas which are most easily ionized.
LUMO map (nucleophilic indicator) - Maps of molecular orbitals may also lead to graphical indicators. For example, the LUMO map, wherein the (absolute value) of the lowest-unoccupied molecular orbital (the LUMO) is mapped onto a size surface (again, most commonly the electron density), providing an indication of nucleophilic reactivity.
Available spectra data and plots for:
Infrared spectroscopy (IR) spectra
Fourier transform spectroscopy (FT-IR)
Raman spectroscopy (IR)
Nuclear magnetic resonance (NMR) spectra
1H chemical shifts and coupling constants (empirical)
13C chemical shifts, Boltzmann averaged shifts, and 13C DEPT spectra
2D H vs H Spectra
COSY plots
2D C vs H Spectra
Heteronuclear single-quantum correlation spectroscopy (HSQC) spectra
HMBC spectra
UV/vis Spectra
Experimental spectra may be imported for comparison with calculated spectra: IR and UV/vis spectra in Joint Committee on Atomic and Molecular Physical Data (JCAMP) (.dx) format and NMR spectra in Chemical Markup Language (.cml) format. Access to public domain spectral databases is available for IR, NMR, and UV/vis spectra.
Spartan accesses several external databases.
Quantum chemical calculations databases:
Spartan Spectra & Properties Database (SSPD) - a set of about 252,000 molecules, with structures, energies, NMR and IR spectra, and wave functions calculated using the EDF2 density functional theory with the 6-31G* basis set.
Spartan Molecular Database (SMD) - a set of about 100,000 molecules calculated from following models:
Hartree–Fock with 3-21G, 6-31G*, and 6-311+G** basis sets
B3LYP density functional with 6-31G* and 6-311+G** basis sets
EDF1 density functional with 6-31G* basis set
MP2 with 6-31G* and 6-311+G** basis sets
G3(MP2)
T1
Experimental databases:
NMRShiftDB - an open-source database of experimental 1H and 13C chemical shifts.
Cambridge Structural Database (CSD) - a large repository of small molecule organic and inorganic experimental crystal structures of about 600,000 entries.
NIST database of experimental IR and UV/vis spectra.
1991 Spartan version 1 Unix
1993 Spartan version 2 Unix
1994 Mac Spartan Macintosh
1995 Spartan version 3 Unix
1995 PC Spartan Windows
1996 Mac Spartan Plus Macintosh
1997 Spartan version 4 Unix
1997 PC Spartan Plus Windows
1999 Spartan version 5 Unix
1999 PC Spartan Pro Windows
2000 Mac Spartan Pro Macintosh
2002 Spartan'02 Unix, Linux, Windows, Mac
2004 Spartan'04
2006 Spartan'06
2008 Spartan'08
2010 Spartan'10
2013 Spartan'14
2016 Spartan'16