
 | ||
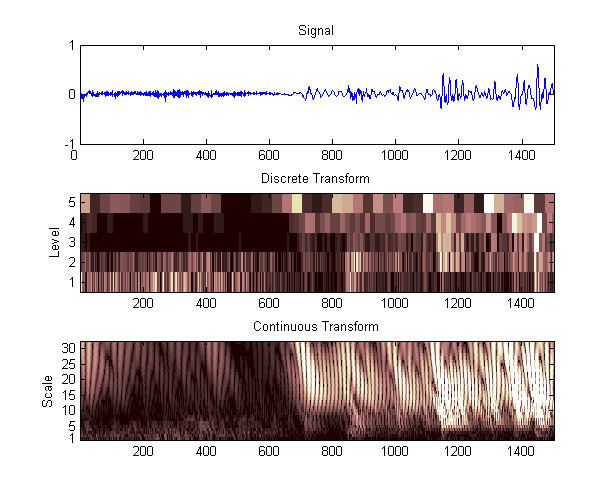
In signal processing, a scaleogram or scalogram is a visual method of displaying a wavelet transform. There are 3 axes: x representing time, y representing scale, and z representing coefficient value. The z axis is often shown by varying the colour or brightness.
A scaleogram is the equivalent of a spectrogram for wavelets.
References
Scaleogram Wikipedia(Text) CC BY-SA