Samiksha Jaiswal (Editor)

Saturation vapor curve

Updated on
Edit
Like
Comment
Share on FacebookTweet on TwitterShare on LinkedInShare on Reddit
Saturation vapor curve

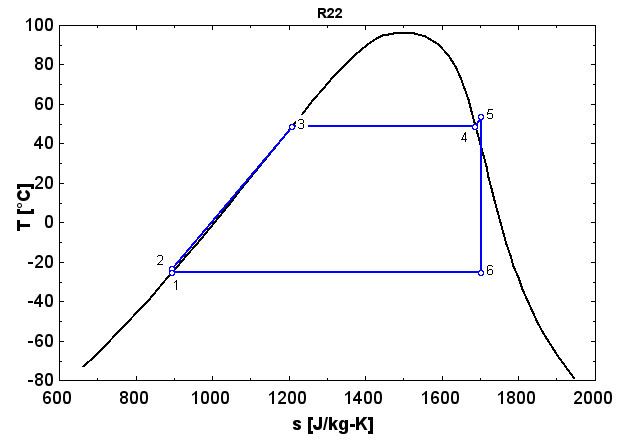
The saturation vapor curve is the curve separating the two-phase state and the superheated vapor state in the T-s diagram. The saturated liquid curve is the curve separating the subcooled liquid state and the two-phase state in the T-s diagram.

When used in a power cycle, the fluid expansion depends strongly on the nature of this saturation curve:

  • A "wet" fluid shows a negative saturation vapor curve. If overheating before the expansion is limited, a two-phase state is obtained at the end of the expansion.
  • An "isentropic" fluid shows a vertical saturation vapor curve. It remains very close to the saturated vapor state after an hypothetical isentropic expansion.
  • A "dry" fluid shows a positive saturation vapor curve. It is in dry vapor state at the end of the expansion, and strongly overheated.
  • References

    Saturation vapor curve Wikipedia