
Country Switzerland Area 185.6 km² Municipalities 9 | Time zone CET (UTC+1) Capital Saint-Maurice Canton Canton of Valais | |
 | ||
Points of interest Grotte aux Fées, Labyrinthe Aventure, Abbey of St Maurice, Verticalp Emosson, Lac de Salanfe | ||
The district of Saint-Maurice is a district in the canton of Valais in Switzerland. It has a population of 13,498 (as of 31 December 2015).
Contents
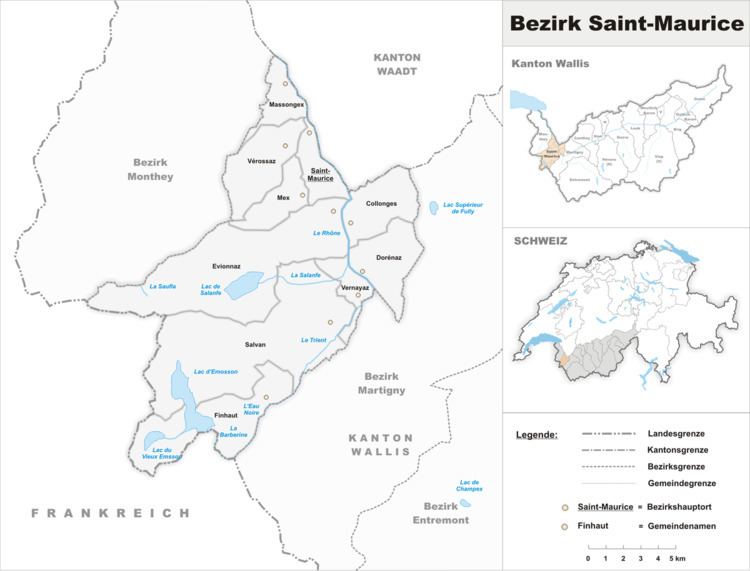
- Map of Saint Maurice Switzerland
- Municipalities
- Mergers and name changes
- Coat of arms
- Demographics
- Politics
- Religion
- Education
- References
Map of Saint-Maurice, Switzerland
Municipalities
It comprises the following municipalities:
Mergers and name changes
On 1 January 2013 the former municipality of Mex (VS) merged into the municipality of Saint-Maurice.
Coat of arms
The blazon of the district coat of arms is Per pale Azure and Gules, overall a Cross bottony Argent.
Demographics
Saint-Maurice has a population (as of December 2015) of 13,498. Most of the population (as of 2000) speaks French (9,391 or 90.1%) as their first language, Italian is the second most common (232 or 2.2%) and German is the third (206 or 2.0%). There are 2 people who speak Romansh.
As of 2008, the gender distribution of the population was 49.3% male and 50.7% female. The population was made up of 4,667 Swiss men (39.0% of the population) and 1,223 (10.2%) non-Swiss men. There were 4,973 Swiss women (41.6%) and 1,089 (9.1%) non-Swiss women. Of the population in the district 4,161 or about 39.9% were born in Saint-Maurice and lived there in 2000. There were 2,565 or 24.6% who were born in the same canton, while 1,720 or 16.5% were born somewhere else in Switzerland, and 1,703 or 16.3% were born outside of Switzerland.
As of 2000, there were 4,330 people who were single and never married in the district. There were 4,926 married individuals, 647 widows or widowers and 517 individuals who are divorced.
There were 1,236 households that consist of only one person and 334 households with five or more people. Out of a total of 4,149 households that answered this question, 29.8% were households made up of just one person and there were 50 adults who lived with their parents. Of the rest of the households, there are 1,042 married couples without children, 1,393 married couples with children There were 233 single parents with a child or children. There were 61 households that were made up of unrelated people and 134 households that were made up of some sort of institution or another collective housing.
The historical population is given in the following chart:
Politics
In the 2007 federal election the most popular party was the CVP which received 39.73% of the vote. The next three most popular parties were the FDP (21.75%), the SP (16.08%) and the SVP (14.41%). In the federal election, a total of 4,751 votes were cast, and the voter turnout was 61.1%.
In the 2009 Conseil d'Etat/Staatsrat election a total of 4,512 votes were cast, of which 271 or about 6.0% were invalid. The voter participation was 58.9%, which is similar to the cantonal average of 54.67%. In the 2007 Swiss Council of States election a total of 4,668 votes were cast, of which 309 or about 6.6% were invalid. The voter participation was 61.5%, which is similar to the cantonal average of 59.88%.
Religion
From the 2000 census, 8,264 or 79.3% were Roman Catholic, while 817 or 7.8% belonged to the Swiss Reformed Church. Of the rest of the population, there were 74 members of an Orthodox church (or about 0.71% of the population), there were 7 individuals (or about 0.07% of the population) who belonged to the Christian Catholic Church, and there were 153 individuals (or about 1.47% of the population) who belonged to another Christian church. There were 7 individuals (or about 0.07% of the population) who were Jewish, and 377 (or about 3.62% of the population) who were Islamic. There were 7 individuals who were Buddhist, 1 person who was Hindu and 10 individuals who belonged to another church. 441 (or about 4.23% of the population) belonged to no church, are agnostic or atheist, and 336 individuals (or about 3.22% of the population) did not answer the question.
Education
In Saint-Maurice about 3,601 or (34.6%) of the population have completed non-mandatory upper secondary education, and 828 or (7.9%) have completed additional higher education (either University or a Fachhochschule). Of the 828 who completed tertiary schooling, 59.2% were Swiss men, 28.7% were Swiss women, 6.4% were non-Swiss men and 5.7% were non-Swiss women.