
 | ||
Relative value is the attractiveness measured in terms of risk, liquidity, and return of one in strument relative to another, or for a given instrument, of one maturity relative to another. The term is used in economics, business or investment.
Contents
In hedge funds
Relative value is a method of determining an asset's value that takes into account the value of similar assets. In contrast, absolute value looks only at an asset's intrinsic value and does not compare it to other assets. Calculations that are used to measure the relative value of stocks include the enterprise ratio and price-to-earnings ratio.
Prices
Prices of valued items undergo questionable fluctuations. For example, even though housing provides the same utility to the individual over time, and supply and demand are relatively constant and stable, the relative price of housing fluctuates. Even more so with Stocks, Oil and Gold. This price volatility appears to occur in cycles and is caused by a myriad of factors.
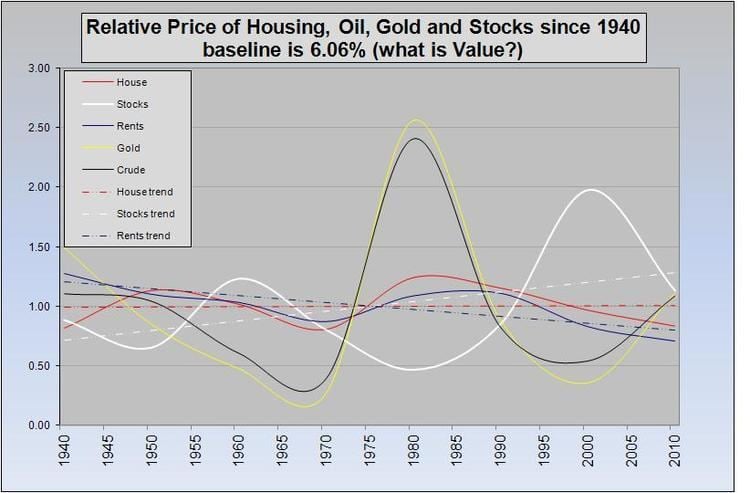
The chart to the right is an attempt to overlay the prices of Housing, Stocks, Oil and Gold by normalizing the price streams. Normalizing is achieved by applying a discounting formula which converts a price to the price it would be at a certain date, given a certain discount rate. This would normally be used to cancel the effects of inflation, in which case the inflation rate would be used.
In this case the rate is derived as follows: A trend was calculated for the resulting discounted price curve using the method of "least squares". The discount rate was then derived by seeking the goal of a trend of 1, i.e. flat. For housing this normalization rate was 6.06% considering the data from 1940 to 2010 relative to the year 1990. Using this as a baseline rate, the normalized price curves were calculated for the other commodities. Oil and Gold had similar normalization rates, but Stocks tended to beat this trend, while rents tended to lose against this trend in the period observed. Gold was the most volatile along with Oil in close second. Stocks were highly volatile. Housing and Rents were the least volatile of the commodities studied.
Questionable Fluctuations
The chart shows quite dramatically that establishing a current value or net worth based on the current price of items in a portfolio will give different results relative to the date at which these values are to be calculated. This is fairly obvious, because it is well known the prices rise and fall. The degree to which they rise and fall though is questionable, if any faith is to be placed in the ability of markets to link price with value. How can it be that oil is deemed to be two and a half times more valuable in 1980 than the baseline. History is showing the markets wild exaggeration of its relative value at that time. It was clearly overvalued, but not only in the sense of a speculative opportunity, more in the sense of that its price became wildly dislocated from what its price should have been compared to other items of value. The market's ability to link price with value perhaps only works in the short term. We know the relative value of the commodities in our shopping basket and are sensitive to relative differences that occur in recent memory, but cognisance of these relative differences suffers slippage over longer periods of time.