
Original author(s) License GNU GPL | Website cern.ch/paw/ | |
 | ||
Initial release 1986; 31 years ago (1986) Stable release 2.13/08 / September 16, 2002; 14 years ago (2002-09-16) | ||
The Physics Analysis Workstation (PAW) is an interactive, scriptable computer software tool for data analysis and graphical presentation in High Energy Physics (HEP).
The development of this software tool started at CERN in 1986, it was optimized for the processing very large amounts of data. It was based on and intended for inter-operation with components of CERNLIB, an extensive collection of Fortran libraries.
PAW has been a standard tool in high energy physics for decades, yet is essentially unmaintained. Despite continuing popularity as of 2008, it has recently been losing ground to the C++-based ROOT package.
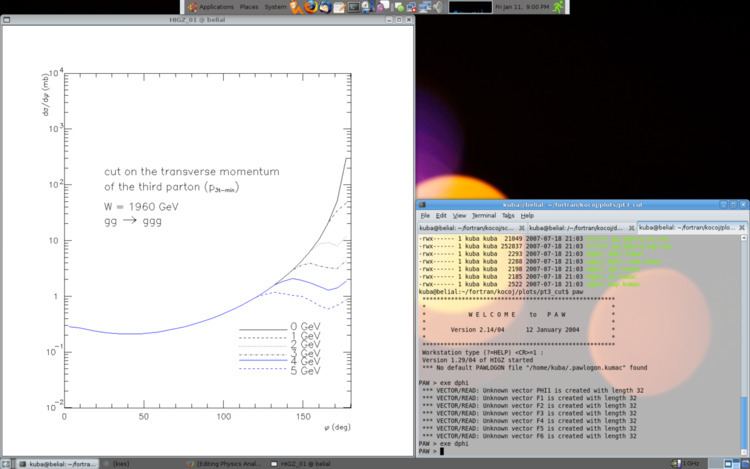
Sample script
PAW uses its own scripting language. Here's a sample code (with its actual output), which can be used to plot data gathered in files.
* read datavector/read X,Y input_file.dat* eps plotfort/file 55 gg_ggg_dsig_dphid_179181.epsmeta 55 -113opt linx | linear scaleopt logy | logarithmic scale* here goes plotset plci 1 | line colorset lwid 2 | line widthset dmod 1 | line type (solid, dotted, etc.)graph 32 X Y AL | 32 stands for input data lines in input file* plot title and commentsset txci 1atitle '[f] (deg)' 'd[s]/d[f]! (mb)'set txci 1text 180.0 2e1 '[f]=179...181 deg' 0.12close 55