
 | ||
A phase portrait is a geometric representation of the trajectories of a dynamical system in the phase plane. Each set of initial conditions is represented by a different curve, or point.
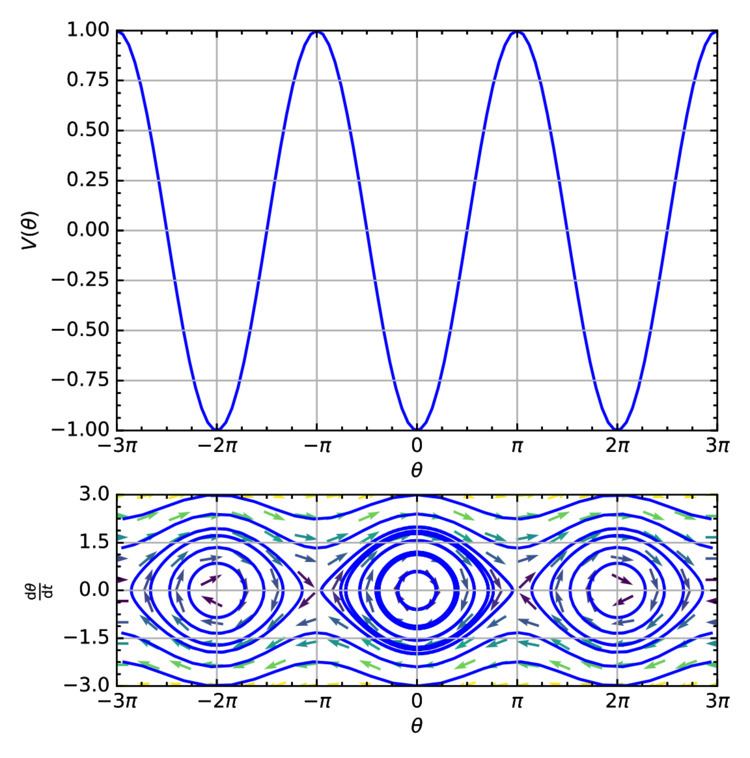
Phase portraits are an invaluable tool in studying dynamical systems. They consist of a plot of typical trajectories in the state space. This reveals information such as whether an attractor, a repellor or limit cycle is present for the chosen parameter value. The concept of topological equivalence is important in classifying the behaviour of systems by specifying when two different phase portraits represent the same qualitative dynamic behavior.
A phase portrait graph of a dynamical system depicts the system's trajectories (with arrows) and stable steady states (with dots) and unstable steady states (with circles) in a state space. The axes are of state variables.