
Country United States FIPS code 29-42536 Elevation 87 m Zip code 63862 Local time Friday 1:50 PM | Time zone Central (CST) (UTC-6) GNIS feature ID 0731603 Area 243 ha Population 1,149 (2013) Area code 573 | |
 | ||
Weather 15°C, Wind SW at 29 km/h, 80% Humidity | ||
Lilbourn is a city in New Madrid County, Missouri, United States. The population was 1,190 at the 2010 census.
Contents
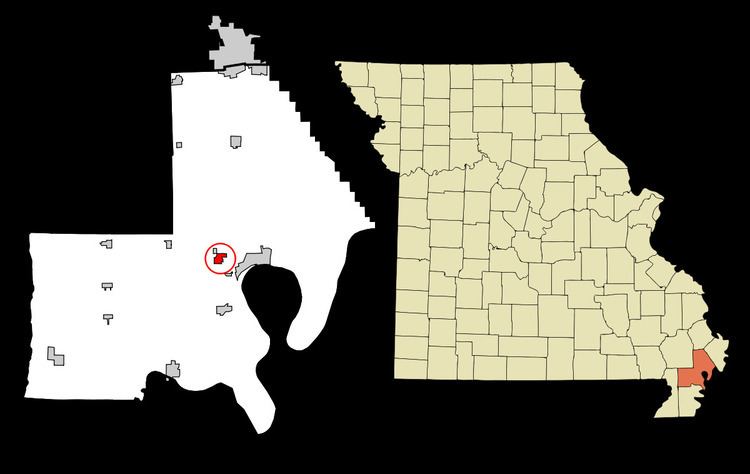
Map of Lilbourn, MO 63862, USA
History
A post office called Lilbourn has been in operation since 1902. The community has the name of Lilbourn Lewis, an early settler.
Geography
Lilbourn is located at 36°35′27″N 89°36′46″W (36.590859, -89.612762).
According to the United States Census Bureau, the city has a total area of 0.94 square miles (2.43 km2), all of it land.
2010 census
As of the census of 2010, there were 1,190 people, 489 households, and 320 families residing in the city. The population density was 1,266.0 inhabitants per square mile (488.8/km2). There were 554 housing units at an average density of 589.4 per square mile (227.6/km2). The racial makeup of the city was 63.95% White, 34.12% Black or African American, 0.25% Native American, and 1.68% from two or more races. Hispanic or Latino of any race were 0.25% of the population.
There were 489 households of which 34.2% had children under the age of 18 living with them, 37.6% were married couples living together, 21.5% had a female householder with no husband present, 6.3% had a male householder with no wife present, and 34.6% were non-families. 30.5% of all households were made up of individuals and 13.5% had someone living alone who was 65 years of age or older. The average household size was 2.43 and the average family size was 2.96.
The median age in the city was 38.7 years. 26.6% of residents were under the age of 18; 9.7% were between the ages of 18 and 24; 22.3% were from 25 to 44; 26.9% were from 45 to 64; and 14.6% were 65 years of age or older. The gender makeup of the city was 46.2% male and 53.8% female.
2000 census
As of the census of 2000, there were 1,303 people, 512 households, and 352 families residing in the city. The population density was 1,482.5 people per square mile (571.7/km²). There were 572 housing units at an average density of 650.8 per square mile (251.0/km²). The racial makeup of the city was 65.46% White, 32.69% African American, 0.08% Native American, 0.08% Asian, 0.92% from other races, and 0.77% from two or more races. Hispanic or Latino of any race were 1.15% of the population.
There were 512 households out of which 35.0% had children under the age of 18 living with them, 44.7% were married couples living together, 19.9% had a female householder with no husband present, and 31.1% were non-families. 27.7% of all households were made up of individuals and 15.6% had someone living alone who was 65 years of age or older. The average household size was 2.54 and the average family size was 3.11.
In the city the population was spread out with 30.9% under the age of 18, 7.4% from 18 to 24, 25.4% from 25 to 44, 22.3% from 45 to 64, and 14.0% who were 65 years of age or older. The median age was 35 years. For every 100 females there were 85.9 males. For every 100 females age 18 and over, there were 78.6 males.
The median income for a household in the city was $23,512, and the median income for a family was $31,786. Males had a median income of $29,688 versus $23,125 for females. The per capita income for the city was $13,460. About 19.0% of families and 25.0% of the population were below the poverty line, including 32.4% of those under age 18 and 29.5% of those age 65 or over.