
 | ||
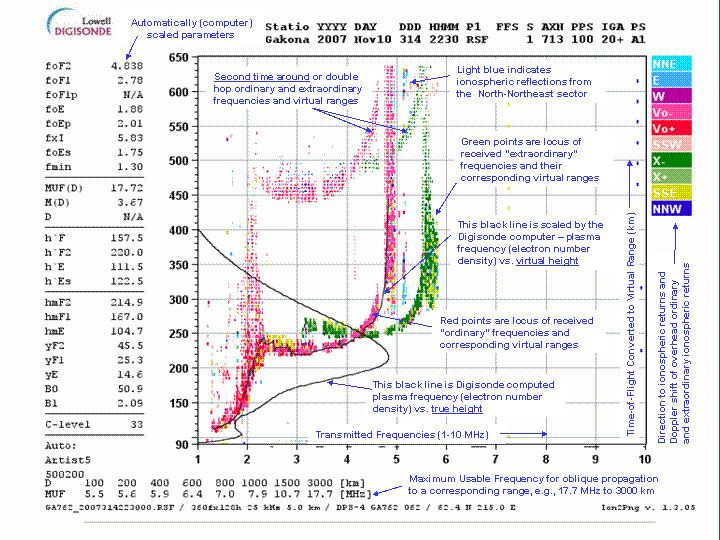
An ionogram is a display of the data produced by an ionosonde. It is a graph of the virtual height of the ionosphere plotted against frequency. Ionograms are often converted into electron density profiles. Data from ionograms may be used to measure changes in the Earth's ionosphere due to space weather events.
References
Ionogram Wikipedia(Text) CC BY-SA