
 | ||
A hydrophilicity plot is a quantitative analysis of the degree of hydrophobicity or hydrophilicity of amino acids of a protein. It is used to characterize or identify possible structure or domains of a protein.
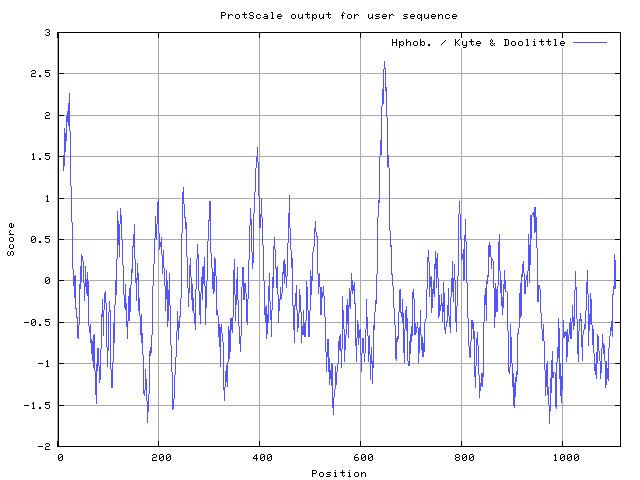
The plot has amino acid sequence of a protein on its x-axis, and degree of hydrophobicity and hydrophilicity on its y-axis. There is a number of methods to measure the degree of interaction of polar solvents such as water with specific amino acids. For instance, the Kyte-Doolittle scale indicates hydrophobic amino acids, whereas the Hopp-Woods scale measures hydrophilic residues.
Analyzing the shape of the plot gives information about partial structure of the protein. For instance, if a stretch of about 20 amino acids shows positive for hydrophobicity, these amino acids may be part of alpha-helix spanning across a lipid bilayer, which is composed of hydrophobic fatty acids. On the converse, amino acids with high hydrophilicity indicate that these residues are in contact with solvent, or water, and that they are therefore likely to reside on the outer surface of the protein.
The data in the above table was generated using a computer program that evaluates the average hydrophobicity of segments within a protein and uses data collected from literature.