
 | ||
A grid view or a datagrid is a graphical control element that presents a tabular view of data. A typical grid view also supports some or all of the following:
An interactive live demo example of this type of widget can be seen here[1].
Some widget toolkits, these are libraries containing a collection of equally designed graphical control elements, distinguish between a grid and a datagrid. If this is the case, the term datagrid refers specifically to a graphical control element that can be linked to a database with little or no effort from the part of a programmer.
They are commonly used to display lists of files, such as the "Details" view in Windows XP file managers.
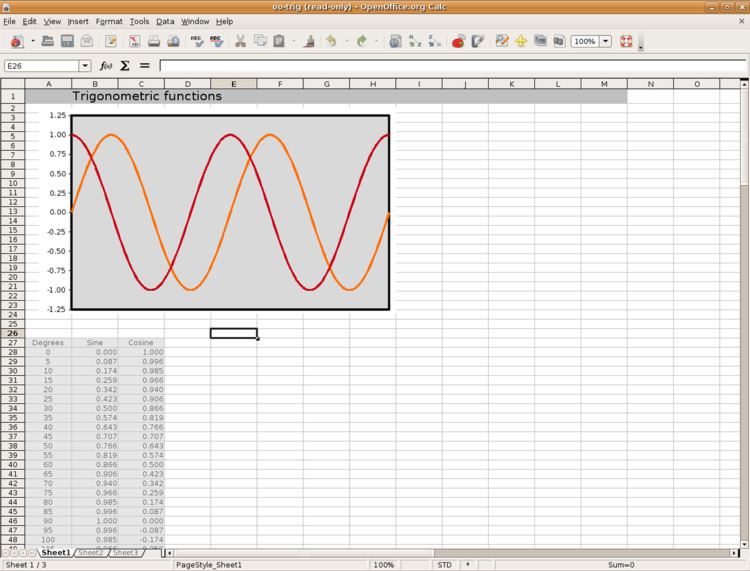
Grid views are sometimes referred to as spreadsheet widgets (or spreadsheet controls, with control being a common synonym for widget). This is due to grid views' visual and sometimes behavioral similarity to spreadsheet applications. However, though many grid views support editing of underlying data, they cannot be used for arbitrary calculations. Spreadsheet widgets occur frequently in scientific applications such as PSPP or SPSS.