
Original author(s) Stable release February 2010 Available in HTTP requests | Initial release 2007 Development status Active, Deprecated | |
 | ||
Website developers.google.com/chart/image/ | ||
The Google Chart API is an interactive Web service (now deprecated) that creates graphical charts from user-supplied data. Google servers create a PNG image of a chart from data and formatting parameters specified by a user's HTTP request. The service supports a wide variety of chart information and formatting. Users may conveniently embed these charts in a Web page by using a simple image tag.
Originally the API was Google's internal tool to support rapid embedding of charts within Google's own applications (like Google Finance for example). Google figured it would be a useful tool to open up to web developers. It officially launched on December 6, 2007.
Currently, line, bar, pie, and radar charts, as well as Venn diagrams, scatter plots, sparklines, maps, google-o-meters, and QR codes are supported.
Google deprecated the API in 2012 with guaranteed availability until April 2015. Google now reserves the right to turn it off without notice, although as of April 2016, there are no plans to do so. Google recommends the successor service Google Charts.
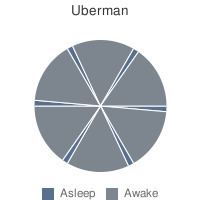
Example
The following URL creates the pie chart below:
http://chart.apis.google.com/chart?
chs=200x200
&chdlp=b
&chtt=Uberman
&chdl=Asleep|Awake
&chd=t:1,11,1,11,1,11,1,11,1,11,1,11
&cht=p
&chco=586F8E,7D858F,586F8E,7D858F,586F8E,7D858F,586F8E,7D858F,586F8E,7D858F,586F8E,7D858F