
 | ||
In materials science and fatigue, the Goodman relation is an equation used to quantify the interaction of mean and alternating stresses on the fatigue life of a material.
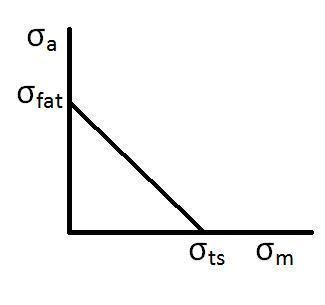
A Goodman diagram, sometimes called a Haigh diagram or a Haigh-Soderberg diagram, is a graph of (linear) mean stress vs. (linear) alternating stress, showing when the material fails at some given number of cycles.
A scatterplot of experimental data shown on such a plot can often be approximated by a parabola known as the Gerber line, which can in turn be (conservatively) approximated by a straight line called the Goodman line.
Mathematical description
The Goodman relation can be represented mathematically as:
Where