
 | ||
In statistics, a Galbraith plot (also known as Galbraith's radial plot or just radial plot), is one way of displaying several estimates of the same quantity that have different standard errors.
It can be used to examine heterogeneity in a meta-analysis, as an alternative or supplement to a forest plot.
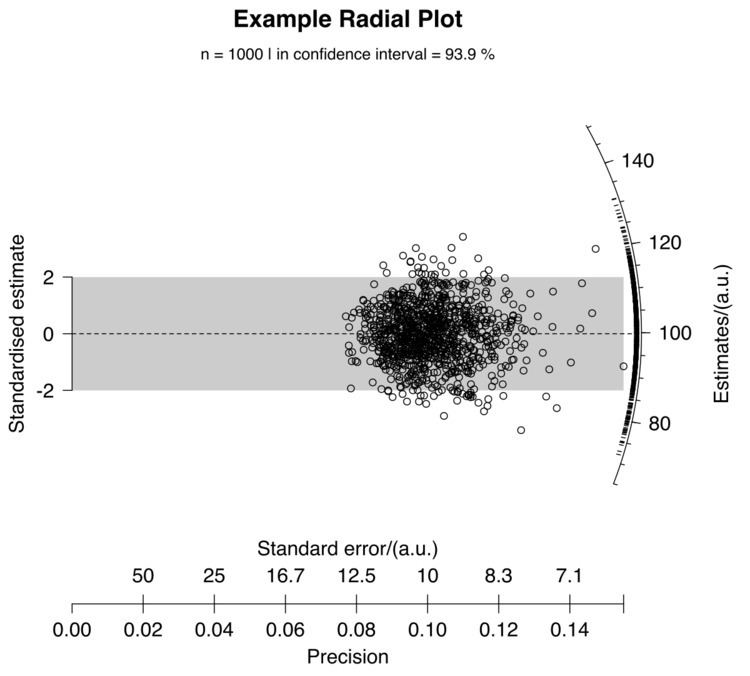
A Galbraith plot is produced by first calculating the standardized estimates or z-statistics by dividing each estimate by its standard error (SE). The Galbraith plot is then a scatter plot of each z-statistic (vertical axis) against 1/SE (horizontal axis). Larger studies (with smaller SE and larger 1/SE) will be observed to aggregate away from the origin.
References
Galbraith plot Wikipedia(Text) CC BY-SA