
Fleiss' kappa (named after Joseph L. Fleiss) is a statistical measure for assessing the reliability of agreement between a fixed number of raters when assigning categorical ratings to a number of items or classifying items. This contrasts with other kappas such as Cohen's kappa, which only work when assessing the agreement between not more than two raters or the interrater reliability for one appraiser versus themself. The measure calculates the degree of agreement in classification over that which would be expected by chance. There is no generally agreed-upon measure of significance, although guidelines have been given.
Contents
Fleiss' kappa can be used only with binary or nominal-scale ratings. No version is available for ordered-categorical ratings.
Introduction
Fleiss' kappa is a generalisation of Scott's pi statistic,[1] a statistical measure of inter-rater reliability.[2] It is also related to Cohen's kappa statistic and Youden's J statistic which may be more appropriate in certain instances[3][4]. Whereas Scott's pi and Cohen's kappa work for only two raters, Fleiss' kappa works for any number of raters giving categorical ratings, to a fixed number of items. It can be interpreted as expressing the extent to which the observed amount of agreement among raters exceeds what would be expected if all raters made their ratings completely randomly. It is important to note that whereas Cohen's kappa assumes the same two raters have rated a set of items, Fleiss' kappa specifically allows that although there are a fixed number of raters (e.g., three), different items may be rated by different individuals (Fleiss, 1971, p.378). That is, Item 1 is rated by Raters A, B, and C; but Item 2 could be rated by Raters D, E, and F.
Agreement can be thought of as follows, if a fixed number of people assign numerical ratings to a number of items then the kappa will give a measure for how consistent the ratings are. The kappa,
(1)
The factor
An example of the use of Fleiss' kappa may be the following: Consider fourteen psychiatrists are asked to look at ten patients. Each psychiatrist gives one of possibly five diagnoses to each patient. These are compiled into a matrix, and Fleiss' kappa can be computed from this matrix (see example below) to show the degree of agreement between the psychiatrists above the level of agreement expected by chance.
Equations
Let N be the total number of subjects, let n be the number of ratings per subject, and let k be the number of categories into which assignments are made. The subjects are indexed by i = 1, ... N and the categories are indexed by j = 1, ... k. Let nij represent the number of raters who assigned the i-th subject to the j-th category.
First calculate pj, the proportion of all assignments which were to the j-th category:
(2)
Now calculate
(3)
Now compute
(4)
(5)
Worked example
In the following example, fourteen raters (
Data
See table to the right.
Sum of all cells = 140
Sum of
Calculations
The value
And taking the second row,
In order to calculate
Over the whole sheet,
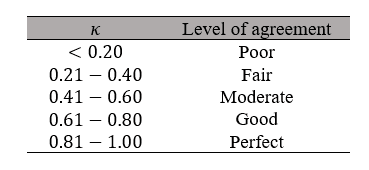
Interpretation
Landis and Koch (1977) gave the following table for interpreting