
 | ||
An ergograph is a graph that shows a relation between human activities, or agricultural/climate factors, and a seasonal year. The name was coined by Dr. Arthur Geddes of the University of Edinburgh. It can either be a polar coördinate (circular) or a cartesian coördinate (rectangular) graph, and either a line graph or a bar graph.
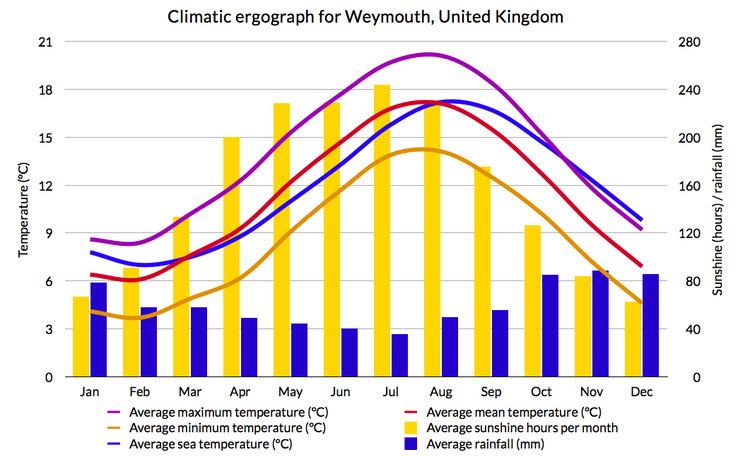
In cartesian form, the X axis is marked for the months of the year, and the Y axis is marked with the scale(s) of the activity/activities. For example, in the ergograph to the right, the Y axis is marked with both temperature and rainfall/sunshine scales.
In polar form, the months of the year are marked around the circumference, forming 30° sectors. Concentric lines display the proportions of time (in hours per day) devoted to each of the activities. The time scale, ranging from 0 to 24 hours per day, is along the radius of the circle, and is a square root scale. This form of an ergograph is also known as a polar line graph or (because the data form "bands" on the graph) a polar strata graph or polar layer graph, the "polar" denoting the system of polar coordinates used on the graph.
Ergographs can record human activities or agricultural/climate information, such as rainfall, temperature, humidity, crop types, and crop acreage.