
 | ||
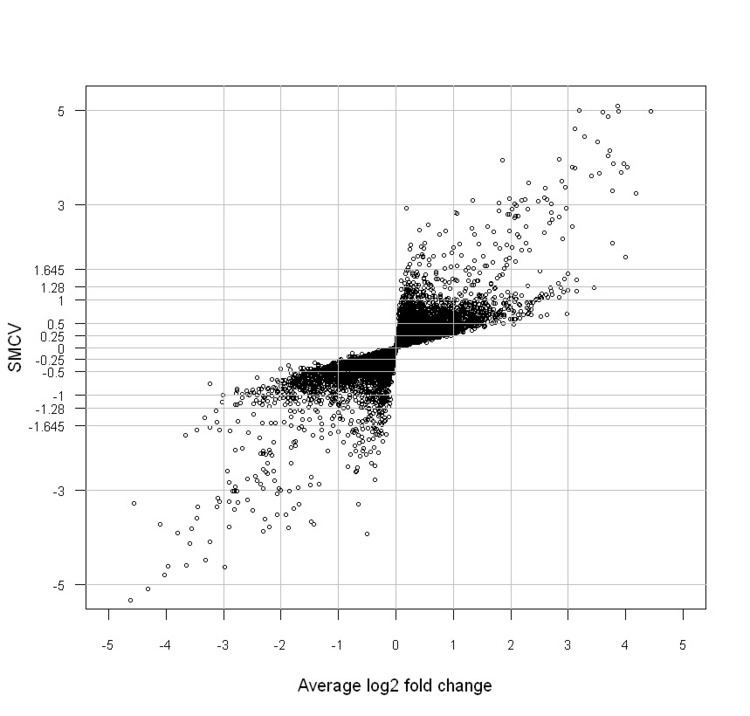
In statistics, a dual-flashlight plot is a type of scatter-plot in which the standardized mean (SMCV) is plotted against the mean of a contrast variable representing a comparison of interest . The commonly used dual-flashlight plot is for the difference between two groups in high-throughput experiments such as microarrays and high-throughput screening studies, in which we plot the SSMD versus average log fold-change on the y- and x-axes, respectively, for all genes or compounds (such as siRNAs or small molecules) investigated in an experiment. As a whole, the points in a dual-flashlight plot look like the beams of a flashlight with two heads, hence the name dual-flashlight plot.
With the dual-flashlight plot, we can see how the genes or compounds are distributed into each category in effect sizes, as shown in the figure. Meanwhile, we can also see the average fold-change for each gene or compound. The dual-flashlight plot is similar to the volcano plot. In a volcano plot, the p-value (or q-value), instead of SMCV or SSMD, is plotted against average fold-change . The advantage of using SMCV over p-value (or q-value) is that, if there exist any non-zero true effects for a gene or compound, the estimated SMCV goes to its population value whereas the p-value (or q-value) for testing no mean difference (or zero contrast mean) goes to zero when the sample size increases . Hence, the value of SMCV is comparable whereas the value of p-value or q-value is not comparable in experiments with different sample size, especially when many investigated genes or compounds do not have exactly zero effects. The dual-flashlight plot bears the same advantage that the SMCV has, as compared to the volcano plot.