
 | ||
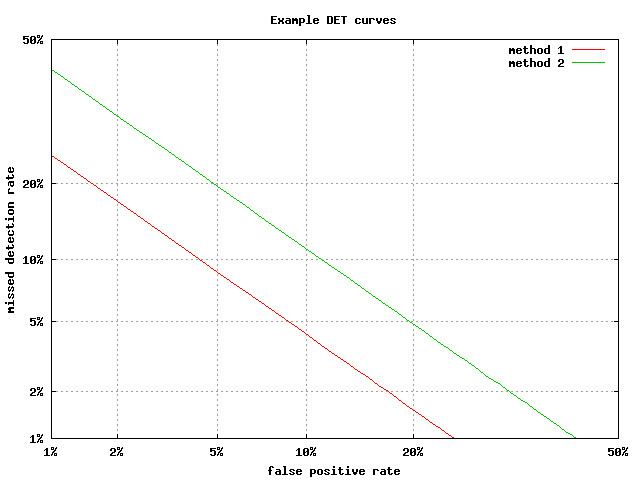
A detection error tradeoff (DET) graph is a graphical plot of error rates for binary classification systems, plotting the false rejection rate vs. false acceptance rate. The x- and y-axes are scaled non-linearly by their standard normal deviates (or just by logarithmic transformation), yielding tradeoff curves that are more linear than ROC curves, and use most of the image area to highlight the differences of importance in the critical operating region.
Axis warping
The normal deviate mapping (or normal quantile function, or inverse normal cumulative distribution) is given by the probit function, so that the horizontal axis is x = probit(Pfa) and the vertical is y = probit(Pfr), where Pfa and Pfr are the false-accept and false-reject rates.
The probit mapping maps probabilities from the unit interval [0,1], to the extended real line [−∞, +∞]. Since this makes the axes infinitely long, one has to confine the plot to some finite rectangle of interest.