
Country United States Time zone Eastern (EST) (UTC-5) Elevation 227 m Local time Friday 10:25 AM | FIPS code 39-20212 Population 225 (2013) | |
 | ||
Weather -1°C, Wind NW at 27 km/h, 63% Humidity Area 127 ha (122 ha Land / 5 ha Water) | ||
Darbyville is a village in Pickaway County, Ohio, United States. The population was 222 at the 2010 census.
Contents
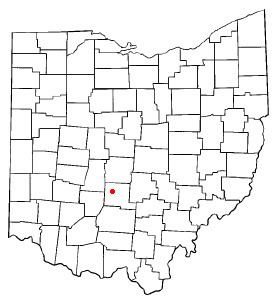
Map of Darbyville, OH, USA
History
Darbyville was laid out in 1826. The village takes its name from nearby Little Darby Creek.
Geography
Darbyville is located at 39°41′44″N 83°6′46″W (39.695622, -83.112768).
According to the United States Census Bureau, the village has a total area of 0.49 square miles (1.27 km2), of which, 0.47 square miles (1.22 km2) is land and 0.02 square miles (0.05 km2) is water.
2010 census
As of the census of 2010, there were 222 people, 79 households, and 58 families residing in the village. The population density was 472.3 inhabitants per square mile (182.4/km2). There were 92 housing units at an average density of 195.7 per square mile (75.6/km2). The racial makeup of the village was 98.2% White, 0.5% African American, and 1.4% from two or more races.
There were 79 households of which 36.7% had children under the age of 18 living with them, 48.1% were married couples living together, 13.9% had a female householder with no husband present, 11.4% had a male householder with no wife present, and 26.6% were non-families. 22.8% of all households were made up of individuals and 12.7% had someone living alone who was 65 years of age or older. The average household size was 2.81 and the average family size was 3.10.
The median age in the village was 38.4 years. 26.6% of residents were under the age of 18; 10% were between the ages of 18 and 24; 24.8% were from 25 to 44; 24% were from 45 to 64; and 14.9% were 65 years of age or older. The gender makeup of the village was 47.7% male and 52.3% female.
2000 census
As of the census of 2000, there were 293 people, 94 households, and 75 families residing in the village. The population density was 627.4 people per square mile (240.7/km²). There were 100 housing units at an average density of 214.1 per square mile (82.1/km²). The racial makeup of the village was 97.27% White. Hispanic or Latino of any race were 2.73% of the population.
There were 94 households out of which 38.3% had children under the age of 18 living with them, 53.2% were married couples living together, 16.0% had a female householder with no husband present, and 20.2% were non-families. 17.0% of all households were made up of individuals and 7.4% had someone living alone who was 65 years of age or older. The average household size was 3.12 and the average family size was 3.41.
In the village, the population was spread out with 31.4% under the age of 18, 5.1% from 18 to 24, 32.1% from 25 to 44, 20.5% from 45 to 64, and 10.9% who were 65 years of age or older. The median age was 34 years. For every 100 females there were 104.9 males. For every 100 females age 18 and over, there were 93.3 males.
The median income for a household in the village was $37,727, and the median income for a family was $37,969. Males had a median income of $28,214 versus $20,000 for females. The per capita income for the village was $11,329. About 18.3% of families and 22.0% of the population were below the poverty line, including 25.9% of those under the age of eighteen and 25.0% of those sixty five or over.