
 | ||
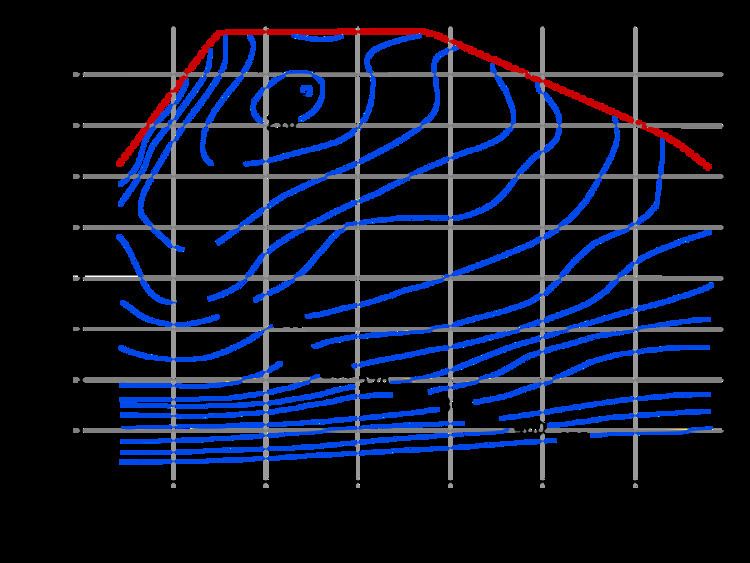
The consumption map or efficiency map shows the brake specific fuel consumption in g per kWh over mean effective pressure per rotational speed of an internal combustion engine.
On the abscissa it shows the rotational speed range. The ordinate is limited by the maximum load of the engine. The lines show the specific fuel consumption and appear similar to a shell.
The map contains each possible condition, combining rotational speed and mean effective pressure. It shows the result of specific fuel consumption. A typical rotation power output P (linear to
The map also shows the effiency of the engine. Depending on the fuel type, diesel and gasoline engines reach up to 210 g per kWh and about 40% of efficiency. Using natural gas this efficiency is reached at 200 g per kWh.
Average values are 160 to 180 g per kWh for slow moving two stroke diesel boat engines using fuel oil, reaching up to 55% efficiency at 300 rpm. 210 to 195 g per kWh at cooled and pre charged diesel engines for passenger cars, trucks 225 to 195 g per kWh. Non charged otto cycle gasoline engines for passenger cars 350 to 250 g per kWh.