
J F M A M J | F M A M J J | |
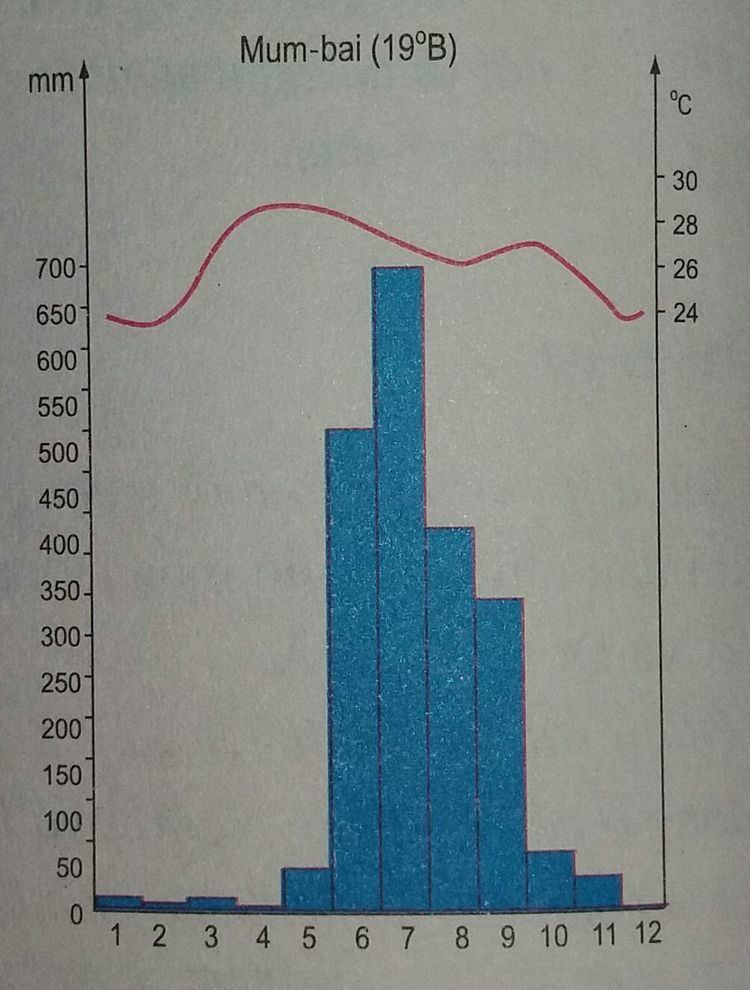 | ||
A climate graph is a chart that shows average weather for a certain period of time, for a certain location. The precipitation is usually shown using a bar graph and the temperature is usually shown as a line graph.
References
Climate graph Wikipedia(Text) CC BY-SA