
 | ||
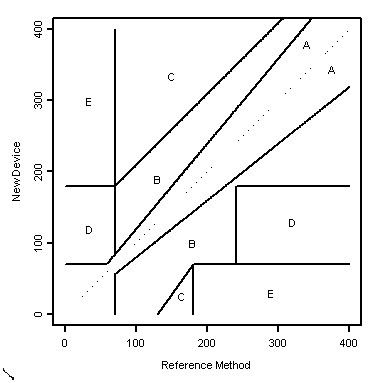
The Clarke Error Grid Analysis (EGA) was developed in 1987 to quantify clinical accuracy of patient estimates of their current blood glucose as compared to the blood glucose value obtained in their meter. It was then used to quantify the clinical accuracy of blood glucose estimates generated by meters as compared to a reference value. A description of the EGA appeared in Diabetes Care in 1987. Eventually, the EGA became accepted as one of the “gold standards” for determining the accuracy of blood glucose meters.
The grid breaks down a scatterplot of a reference glucose meter and an evaluated glucose meter into five regions:
References
Clarke Error Grid Wikipedia(Text) CC BY-SA