
 | ||
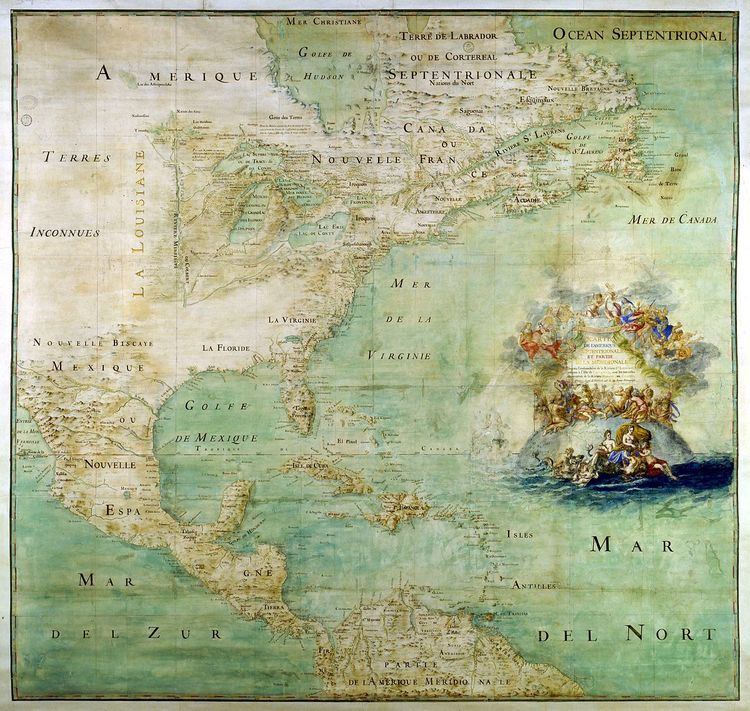
Maps of the New World had been produced since the 16th century. The history of cartography of the United States begins in the 18th century, after the declared independence of the Thirteen original colonies on July 4, 1776, during the American Revolutionary War (1775-1783). Later, Samuel Augustus Mitchell published a map of the United States in 1867. The National Program for Topographic Mapping was initiated in 1884 by the United States Geological Survey.
Changes to territories
As the United States of America changed territorial lines, maps were updated and redrawn, e.g. when the new state Hawaii was added on August 21, 1959.
Some maps show the state lines (boundaries) of the individual states, whereas other maps simply show the national boundaries between the United States and other nations. The United States consists of 50 states and covers the total area of 3,679,245 sq. miles. The population of the United States was 281,421,906 in 2000 census. There are 79.6 persons on average per square mile. In 2003 the estimated population of the country was 291,587,000.
The map of the US shows that it is bordered with Canada on the North, by Mexico on South and the Bahamas on the southeast. Alaska, a state of the USA, is bordered with Canada on the East and Russia on the west. The map also shows the relation of the country with its neighbor hood countries. The names and boundaries of each state are shown in the map.