
 | ||
A bullet graph is a variation of a bar graph developed by Stephen Few. Seemingly inspired by the traditional thermometer charts and progress bars found in many dashboards, the bullet graph serves as a replacement for dashboard gauges and meters. Bullet graphs were developed to overcome the fundamental issues of gauges and meters: they typically display too little information, require too much space, and are cluttered with useless and distracting decoration. The bullet graph features a single, primary measure (for example, current year-to-date revenue), compares that measure to one or more other measures to enrich its meaning (for example, compared to a target), and displays it in the context of qualitative ranges of performance, such as poor, satisfactory, and good. The qualitative ranges are displayed as varying intensities of a single hue to make them discernible by those who are color blind and to restrict the use of colors on the dashboard to a minimum.
Below is an example of a single bullet graph:
Below is the same example, this time with labels to identify each part of the bullet graph.
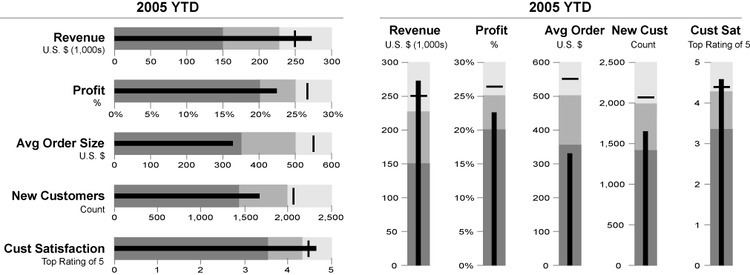
Bullet graphs may be horizontal or vertical, and may be stacked to allow comparisons of several measures at once, as illustrated below.
More information about bullet graphs can be found in the book Information Dashboard Design by Stephen Few.