In condensed matter physics, an Arrott plot is a plot of the square of the magnetization M 2 of a substance, against the ratio of the applied magnetic field to magnetization H / M at one (or several) fixed temperature(s). Arrott plots are an easy way of determining the presence of ferromagnetic order in a material. They are named after American physicist Anthony Arrott who introduced them as a technique for studying magnetism in 1957.
According to the Ginzburg-Landau mean field picture for magnetism, the free energy of a ferromagnetic material close to a phase transition can be written as:
F ( M ) = − H M + a T − T c T c M 2 + b M 4 + …
where M , the magnetization, is the order parameter, H is the applied magnetic field, T c is the critical temperature, and a , b are material constants.
Close to the phase transition, this gives a relation for the magnetization order parameter:
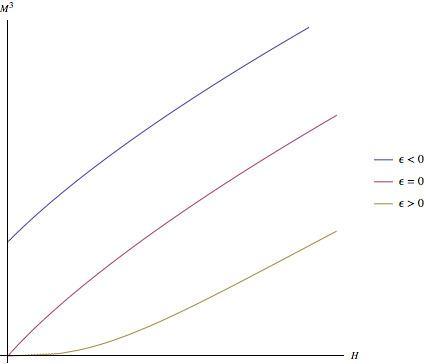
M 2 = 1 4 b H M − a 2 b ϵ
where ϵ = T − T c T c is a dimensionless measure of the temperature.
Thus in a graph plotting M 2 vs. H / M for various temperatures, the line without an intercept corresponds to the dependence at the critical temperature. Thus along with providing evidence for the existence of a ferromagnetic phase, the Arrott plot can also be used to determine the critical temperature for the phase transition.