
 | ||
The Arctic oscillation (AO) or Northern Annular Mode/Northern Hemisphere Annular Mode (NAM) is an index (which varies over time with no particular periodicity) of the dominant pattern of non-seasonal sea-level pressure variations north of 20N latitude, and it is characterized by pressure anomalies of one sign in the Arctic with the opposite anomalies centered about 37–45N. The AO is believed by climatologists to be causally related to, and thus partially predictive of, weather patterns in locations many thousands of miles away, including many of the major population centers of Europe and North America. NASA climatologist Dr. James E. Hansen explained the mechanism by which the AO affects weather at points so distant from the Arctic, as follows:
This zonally symmetric seesaw between sea level pressures in polar and temperate latitudes was first identified by Edward Lorenz and named in 1998 by David W.J. Thompson and John Michael Wallace.
The North Atlantic oscillation (NAO) is a close relative of the AO and there exist arguments about whether one or the other is more fundamentally representative of the atmosphere's dynamics; Ambaum et al. argue that the NAO can be identified in a more physically meaningful way.
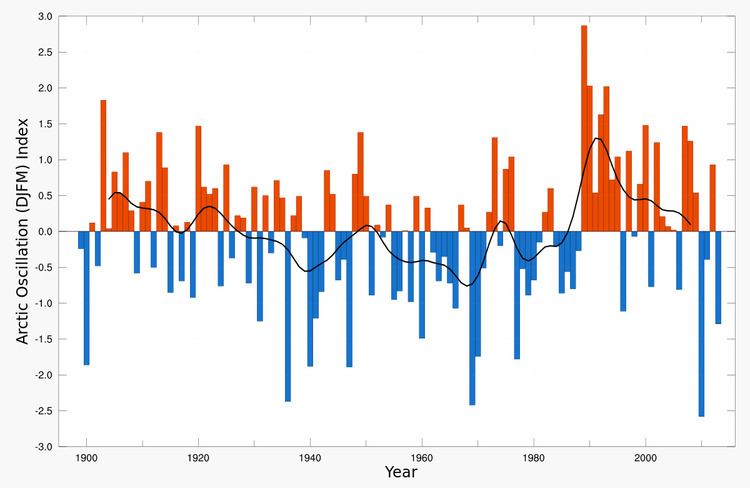
Over most of the past century, the Arctic Oscillation alternated between its positive and negative phases. Starting in the 1970s the oscillation has trended to more of a positive phase when averaged using a 60-day running mean, though it has trended to a more neutral state in the last decade. The oscillation still fluctuates stochastically between negative and positive values on daily, monthly, seasonal and annual time scales, although, despite its stochastic nature, meteorologists have attained high levels of predictive accuracy in recent times, at least for the shorter term forecasts. (The correlation between actual observations and the 7-day mean GFS ensemble AO forecasts is approximately 0.9, a figure at the high end for that statistic.)
The National Snow and Ice Data Center describes the effects of the AO in some detail:
"In the positive phase, higher pressure at midlatitudes drives ocean storms farther north, and changes in the circulation pattern bring wetter weather to Alaska, Scotland and Scandinavia, as well as drier conditions to the western United States and the Mediterranean. In the positive phase, frigid winter air does not extend as far into the middle of North America as it would during the negative phase of the oscillation. This keeps much of the United States east of the Rocky Mountains warmer than normal, but leaves Greenland and Newfoundland colder than usual. Weather patterns in the negative phase are in general "opposite" to those of the positive phase."Climatologists are now routinely invoking the Arctic Oscillation in their official public explanations for extremes of weather. The following statement from the National Oceanic and Atmospheric Administration's National Climatic Data Center: State of the Climate December 2010 which uses the phrase "negative Arctic Oscillation" four times, is very representative of this increasing tendency:
A further, quite graphic illustration of the effects of the negative phase of the oscillation occurred in February 2010. In that month, the Arctic Oscillation reached its most negative monthly mean value, −4.266, in the entire post-1950 era (the period of accurate record-keeping). That month was characterized by three separate historic snowstorms that occurred in the mid-Atlantic region of the United States. The first storm dumped 25 inches (640 mm) on Baltimore, Maryland, on February 5–6, and then a second storm dumped 19.5 inches (500 mm) on February 9–10. In New York City, a separate storm deposited 20.9 inches (530 mm) on February 25–26. This kind of snowstorm activity is as anomalous and extreme as the negative AO value itself. Similarly, the greatest negative value for the AO since 1950 in January was −3.767 in 1977, which coincided with the coldest mean January temperature in New York City, Washington, D.C., Baltimore, and many other mid-Atlantic locations in that span of time. And though the January AO has been negative only 60.6% of the time between 1950 and 2010, 9 of the 10 coldest Januarys in New York City since 1950 have coincided with negative AOs.
However, the correlation between sharply negative Arctic Oscillations and excessive winter cold and snow in regions vulnerable in that way to these negative AOs should not be overstated. It is by no means a simple, one-to-one equivalence. An extreme Arctic Oscillation does not necessarily mean extreme weather will occur. For example, since 1950, eight out of the 10 coldest Januarys in New York did not coincide with the 10 lowest January AO values. And the fourth warmest January there since 1950 coincided with one of those 10 most negative AOs. So, although many climatologists believe that the Arctic Oscillation affects the probability of certain weather events occurring in certain places, the heightened chance of a phenomenon by no means assures it, nor does the lessened likelihood exclude it. Further, the precise value of the AO index only imperfectly reflects the severity of the weather associated with it.