
Written in C++ | Platform x86 & x86-64 | |
 | ||
Developer(s) Zuse Institute BerlinFEI Visualization Sciences Group Initial release October 1999; 17 years ago (1999-10) Stable release 6.1.1 / May 1, 2016; 9 months ago (2016-05-01) Operating system | ||
Amira (pronounce: Ah-meer-ah) is a software platform for 3D and 4D data visualization, processing, and analysis. It is being actively developed by Visualization Sciences Group, Bordeaux, France and the Zuse Institute Berlin (ZIB), Germany.
Contents
Overview
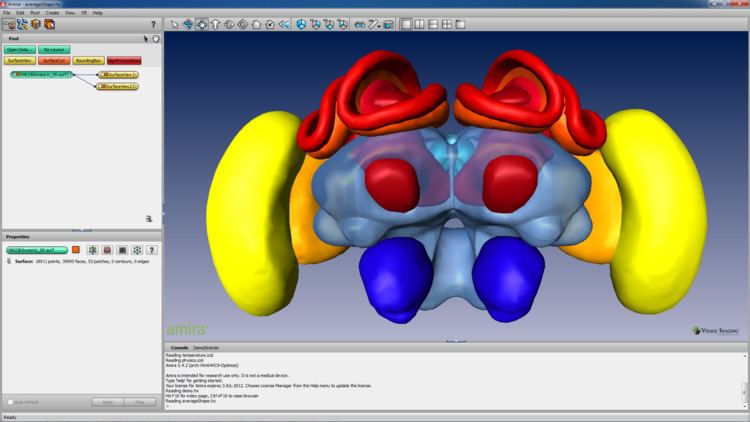
Amira is an extendable software system for scientific visualization, data analysis, and presentation of 3D and 4D data. Amira is being developed and commercially distributed by FEI in cooperation with the Zuse Institute Berlin (ZIB). It is used by several thousand researchers and engineers in academia and industry around the world. Amira’s flexible user interface and its modular architecture make it a universal tool for processing and analysis of data from various modalities; e.g. micro-CT, PET, Ultrasound. Its ever-expanding functionality has made it a versatile data analysis and visualization solution, applicable to and being used in many fields, such as microscopy in biology and materials science, molecular biology, quantum physics, astrophysics, computational fluid dynamics (CFD), finite element modeling (FEM), non-destructive testing (NDT), and many more. One of the key features, besides data visualization, is Amira’s set of tools for image segmentation and geometry reconstruction. This allows the user to mark (or segment) structures and regions of interest in 3D image volumes using automatic, semi-automatic, and manual tools. The segmentation can then be used for a variety of subsequent tasks, such as volumetric analysis, density analysis, shape analysis, or the generation of 3D computer models for visualization, numerical simulations, or rapid prototyping or 3D printing, to name a few. Other key Amira features are multi-planar and volume visualization, image registration, filament tracing, cell separation and analysis, tetrahedral mesh generation, fiber-tracking from diffusion tensor imaging (DTI) data, skeletonization, spatial graph analysis, and stereoscopic rendering of 3D data over multiple displays including CAVEs (Cave automatic virtual environments). As a commercial product Amira requires the purchase of a license or an academic subscription. A time-limited, but full-featured evaluation version is available for download free of charge.
1994–1998 Research Software
Amira’s roots go back to 1994 and the Department for Scientific Visualization, headed by Hans-Christian Hege at the Zuse Institute Berlin (ZIB). The ZIB is a research institute for mathematics and informatics. The Scientific Visualization department’s mission is to help solve computationally and scientifically challenging tasks in medicine, biology, and engineering. For this purpose, it develops algorithms and software for 2D, 3D, and 4D data visualization and visually supported exploration and analysis. At that time, the young visualization group at the ZIB had experience with the extendable, data flow-oriented visualization environments apE, IRIS Explorer, and Advanced Visualization Studio (AVS), but was not satisfied with these products’ interactivity, flexibility, and ease-of-use for non-computer scientists.
Therefore, in a subproject within a medically oriented, multi-disciplinary collaborative research center the development of a new software system was started in early 1994. The initial development was performed by Detlev Stalling, who later became the chief software architect. The software system was called “HyperPlan”, highlighting its initial target application – a planning system for hyperthermia cancer treatment. The system was being developed on Silicon Graphics (SGI) computers, which at the time were the standard workstations used for high-end graphics computing. Software development was based on libraries such as OpenGL, SGI Open Inventor, and the graphical user interface libraries X11, Motif (software), and ViewKit. In 1998, X11/Motif/Viewkit were replaced by the Qt toolkit.
The HyperPlan framework served as the base for more and more projects at the ZIB and was used by a growing number of researchers in collaborating institutions. The projects included applications in neurobiology, confocal microscopy, flow visualization, molecule visualization and analysis and computational astrophysics.
1998–today Commercially Supported Product
The growing number of users of the system started to exceed the capacities that ZIB could spare for software distribution and support, as ZIB’s primary mission was algorithmic research. Therefore, the spin-off company Indeed, – Visual Concepts GmbH was founded by Hans-Christian Hege, Detlev Stalling, and Malte Westerhoff with the vision of making the extensive capabilities of the software available to researchers in industry and academia worldwide and to provide the product support and robustness needed in today’s fast-paced and competitive world.
In Feb 1998 the HyperPlan software was given the new, less application-specific name “Amira”. This name is not an acronym but was chosen for being pronounceable in different languages, starting with an ‘A’, and having an appropriate connotation: the Latin verb “admirare” (to admire), meaning “to look at” and “to wonder at”, describes a typical situation in data visualization.
A major re-design of the software was undertaken by Detlev Stalling and Malte Westerhoff in order to make it a commercially supportable product and to make it available on non-SGI computers as well. In March 1999, the first version of the commercial Amira was shown at the CeBIT tradeshow in Hannover, Germany on SGI IRIX and Hewlett-Packard UniX (HP-UX). Versions for Linux and Microsoft Windows followed within the following twelve months. Later Mac OS X support was added. Indeed, – Visual Concepts selected the Bordeaux, France and San Diego, United States based company TGS, Inc. as the worldwide distributor for Amira and completed five major releases (up to version 3.1) in the subsequent four years.
In 2003 both Indeed, as well as TGS were acquired by Massachusetts-based Mercury Computer Systems, Inc. (NASDAQ:MRCY) and became part of Mercury’s newly formed life sciences business unit, later branded Visage Imaging. In 2009, Mercury Computer Systems, Inc. spun off Visage Imaging again and sold it to Melbourne, Australia based Promedicus Ltd (ASX:PME), a leading provider of radiology information systems and medical IT solutions. During this time, Amira continued to be developed in Berlin, Germany and in close collaboration with the ZIB, still headed by the original creators of Amira. TGS, located in Bordeaux, France was sold by Mercury Computer systems to a French investor and renamed to Visualization Sciences Group (VSG). VSG continued the work on a complementary product named Avizo, based on the same source code but customized for material sciences.
In August 2012, FEI, to that date the largest OEM reseller of Amira, purchased VSG and the Amira business from Promedicus. In August 2013, Visualization Sciences Group (VSG) became a business unit of FEI. Amira and Avizo are still being marketed as two different products; Amira for life sciences and Avizo for materials science, but the development efforts are now joined once again. As in the beginning, the Amira roadmap continues to be driven by the interesting and challenging scientific questions that Amira users around the world are trying to answer, often at the leading edge in their fields.